When to Sell Crypto: Technical Signals That Say "Take Profit"
fomoMay 20, 2026

The hardest trade in crypto isn't the buy — it's the sell. Anyone can ape into a token on hype. But knowing *when to walk away with profits in hand* separates traders who actually make money from those who watch their unrealized gains evaporate in the next correction.
The problem? Most traders don't have a system. They sell on feeling — and feelings in crypto usually mean selling too late (after a crash) or too early (and then watching the chart climb without them). Neither outcome is necessary.
This article gives you five technical signals, each with a chart example, that tell you when to start taking profits. You don't need to be a professional analyst. You just need to recognize the patterns and act on them.
TL;DR: Five chart-based signals — RSI overbought reversal, MACD bearish crossover, Bollinger Band rejection, bearish divergence, and volume dry-up — form a reliable take-profit framework. When two or more fire at once, it's time to start trimming your position. This guide is for any crypto trader who's ever watched gains disappear and thought "I should have sold."
Why Most Crypto Traders Sell Too Late
Before diving into the signals, it's worth understanding *why* selling is so hard.
Greed disguised as conviction
Your position is up 150%. Instead of trimming, you convince yourself it's going to 300%. You've been right so far — why stop now? The chart answers that question brutally a few days later.
No predefined exit plan
If you didn't decide *when* to sell before you bought, you're relying on real-time decision-making in an emotional state. That's how you end up holding through a 60% drawdown because "it'll come back."
Social media confirmation bias
Your timeline is full of rocket emojis and "we're so early." Selling feels like betrayal. But the people posting rockets rarely post their losses.
The antidote to all three is a rule-based system. Here are the five technical signals that form one.
The 5 Technical Sell Signals Every Crypto Trader Should Know
Signal 1: RSI Overbought Reversal
The Relative Strength Index (RSI) measures momentum on a 0–100 scale. When it rises above 70, the asset is considered "overbought" — meaning buyers have been aggressively pushing price up and a cooldown may be imminent.
The sell signal isn't RSI being above 70 — it's RSI dropping back below 70 after being overbought. That rollover means buying momentum is fading. Sellers are starting to show up.
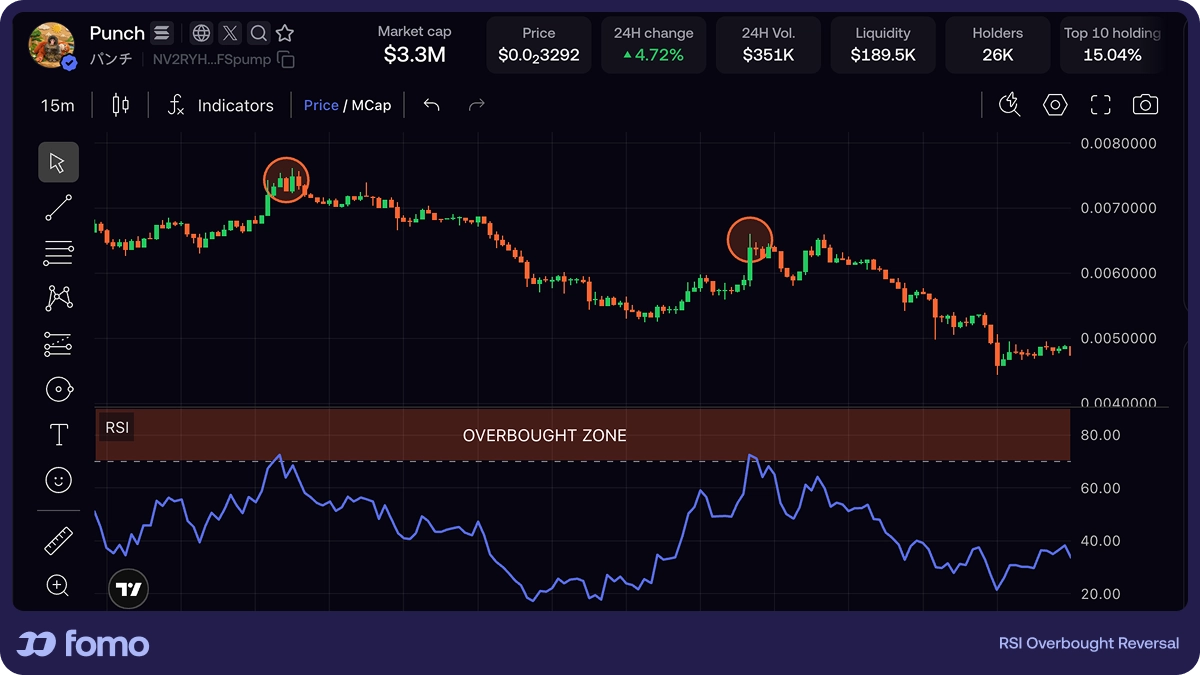
How to use it: When RSI drops back below 70 after an extended rally, consider selling 25–50% of your position. If other signals confirm, sell more.
One caveat: In very strong trends, RSI can stay above 70 for days or even weeks. That's why this signal is most powerful when combined with at least one other indicator from this list.
Signal 2: MACD Bearish Crossover
The Moving Average Convergence Divergence (MACD) tracks the relationship between two exponential moving averages — typically the 12-period and 26-period EMA. It generates a sell signal when the MACD line crosses below the signal line, especially when this happens above the zero line (meaning the asset has been in an uptrend).
When the MACD histogram flips from positive to negative, momentum has shifted from buyers to sellers.
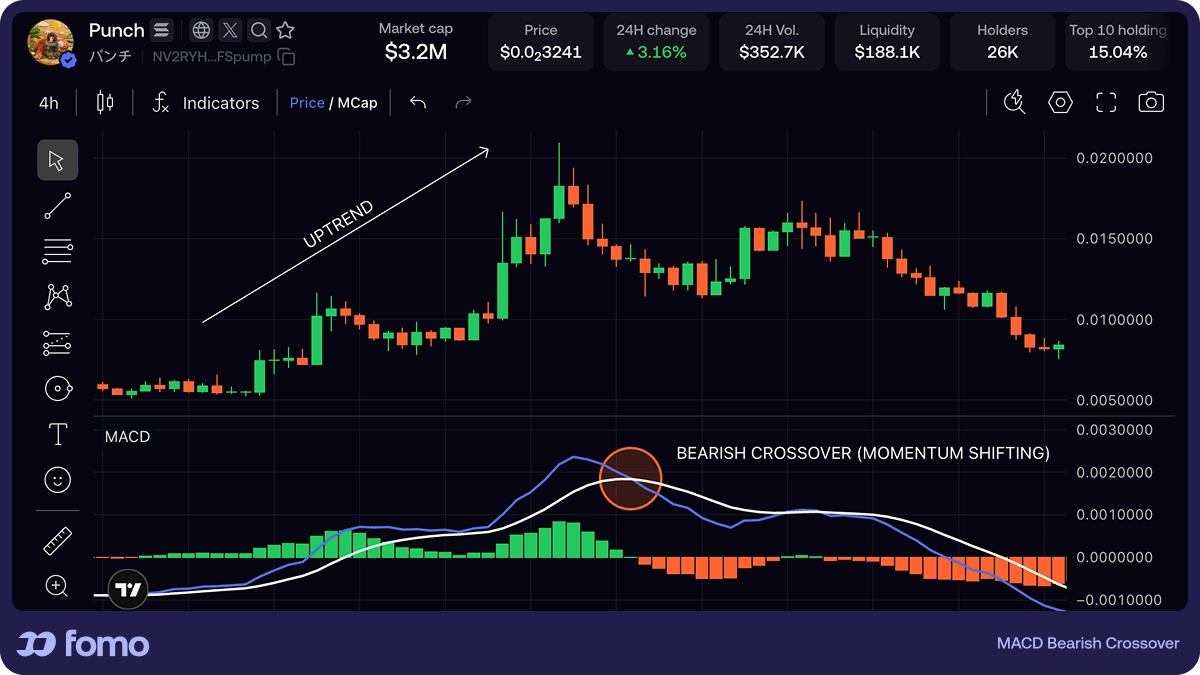
How to use it: A bearish MACD crossover above the zero line is the most significant version of this signal. It means the asset was in a healthy uptrend and momentum is now reversing. Combine with RSI for higher confidence.
Signal 3: Bollinger Band Upper Rejection
Bollinger Bands consist of three lines: a 20-period moving average in the middle, and upper/lower bands set two standard deviations away. When price tags the upper band and then closes back inside the bands, it's often an early warning that the rally is overextended.
This signal becomes especially powerful when the rejection happens alongside declining volume (Signal 5) or a shrinking MACD histogram.
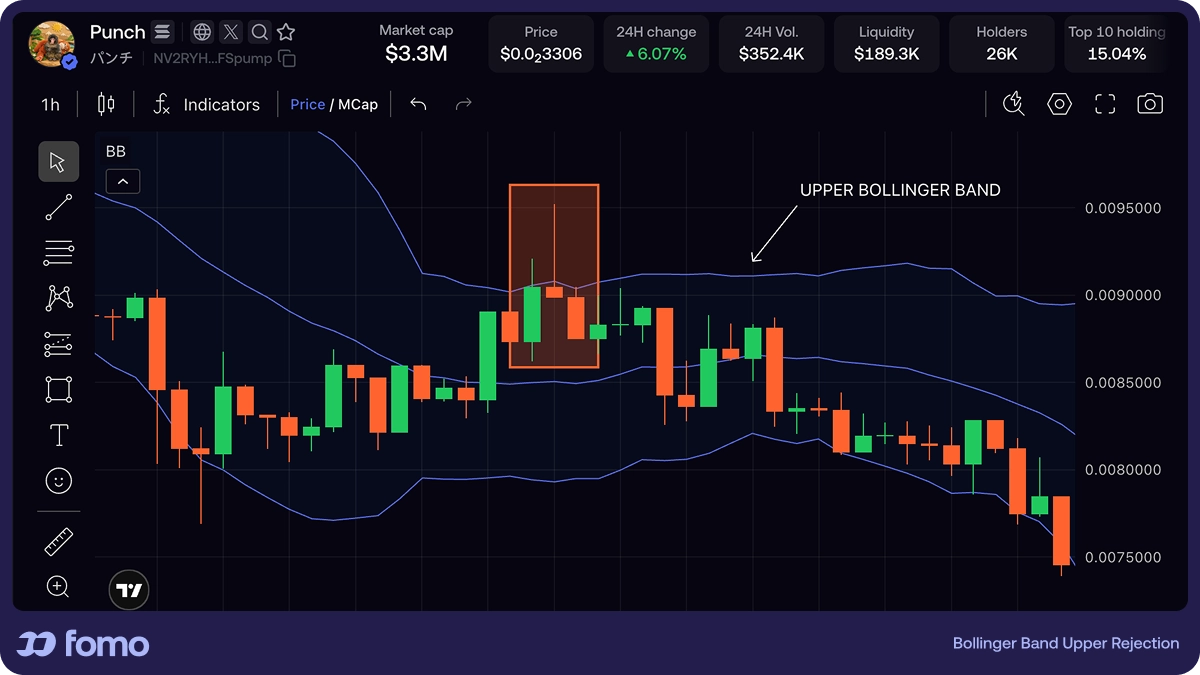
How to use it: A Bollinger Band upper rejection is a warning shot, not necessarily a full exit signal on its own. Use it to tighten your risk-off level and prepare for a potential correction. If RSI is also rolling over or MACD is crossing, the signal strengthens considerably.
Signal 4: Bearish Divergence
Bearish divergence is one of the most reliable exhaustion signals in technical analysis. It occurs when price makes a higher high but a momentum indicator (RSI or MACD) makes a lower high. The message: price is still rising, but the strength behind it is fading.
Think of it like a car accelerating uphill while the engine RPMs are dropping. The car is still moving — but it's about to stall.
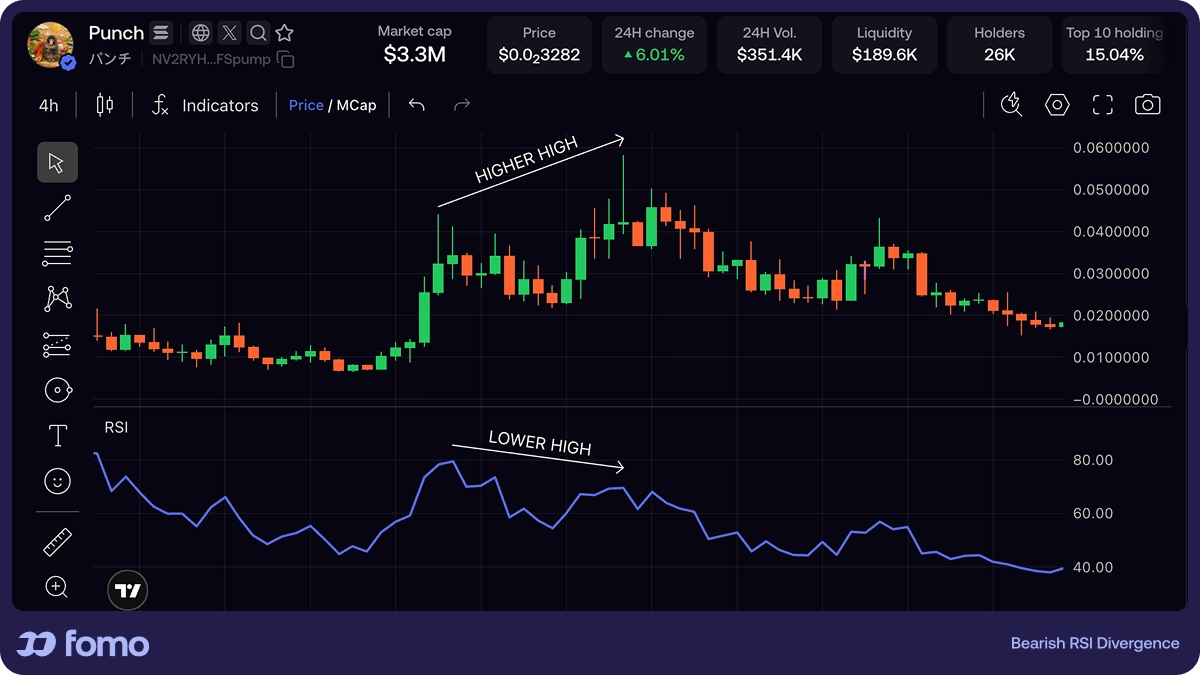
How to use it: Bearish divergence doesn't mean "sell immediately." It means "momentum is weakening — prepare for a reversal." When you spot it, tighten your risk-off level, stop adding to the position, and begin scaling out if other signals confirm.
Signal 5: Volume Drying Up on New Highs
Healthy rallies are driven by increasing volume — more participants are buying in and confirming the move. When price pushes to new highs but volume is *declining*, it means fewer traders are participating in the move. The rally is running on fumes.
This is sometimes called "volume-price divergence," and it's a classic setup that precedes reversals across every asset class, not just crypto.
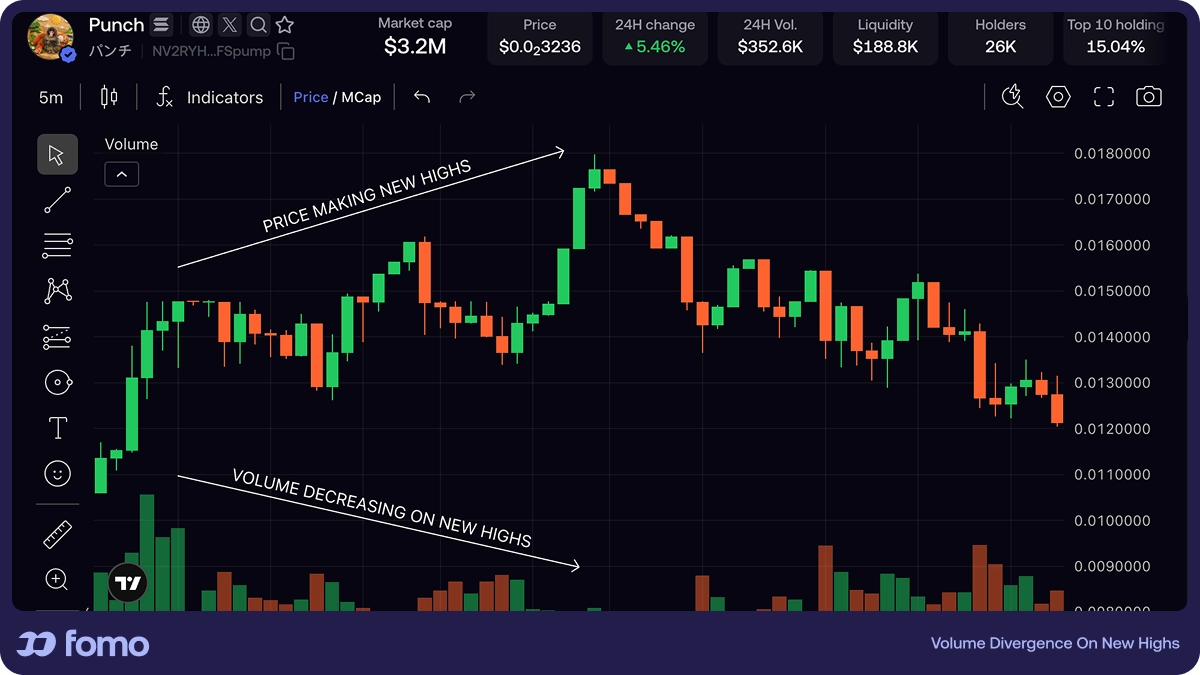
How to use it: Declining volume on new highs is your earliest warning sign. It often appears before RSI or MACD roll over. When you see it, pay close attention to the other four signals — if even one more fires, start trimming.
The Sell-Signal Confluence Checklist
No single indicator is perfect. Crypto is volatile, and any one signal can produce false positives. The power of this framework is confluence — when multiple independent signals align, the probability of a real reversal goes up dramatically.
How to use the checklist:
1. 1 signal fires → Move your risk-off level tighter. Stay alert, but don't necessarily sell yet.
2. 2 signals fire → Begin trimming. Sell 25–33% of your position.
3. 3 or more signals fire → Trim aggressively. Sell 50–75% and let the remaining position ride with a tight trailing take-profit.
| Signal | What to Look For | Status |
|---|---|---|
| RSI Overbought Reversal | RSI drops below 70 after being overbought | ☐ |
| MACD Bearish Crossover | MACD line crosses below signal line above zero | ☐ |
| Bollinger Band Rejection | Price tags upper band, closes back inside | ☐ |
| Bearish Divergence | Price higher high + indicator lower high | ☐ |
| Volume Dry-Up | New price highs on declining volume | ☐ |
Print this. Tape it next to your screen. Use it every time you're sitting on profits and wondering whether to sell.
How to Actually Take Profits
Recognizing a sell signal is only half the equation. How you sell matters just as much.
Ladder Out (DCA in Reverse)
Instead of selling your entire position at one price, sell in increments. If you're holding $10,000 in a token and two sell signals fire, sell $2,500 at the current price. If the price drops further and a third signal fires, sell another $2,500. If the price recovers, you still have exposure.
This approach removes the pressure of finding "the perfect top" — because nobody finds it consistently.
Rebalancing Threshold
If one position grows to an outsized percentage of your portfolio — say 40% when your target was 20% — rebalancing forces you to sell the excess. This is profit-taking with a built-in framework that doesn't require reading a single chart.
Three Common Profit-Taking Mistakes
Mistake 1: Waiting for the "perfect" top
It doesn't exist. Every experienced trader has a story about holding through a peak because they wanted 10% more. The best exit is one you planned, not one you hope for.
Mistake 2: Ignoring signals because of social media hype
When your feed is euphoric and every indicator is flashing caution, trust the charts. Social sentiment is a lagging indicator — by the time everyone is bullish, the smart money is often already trimming.
Mistake 3: Selling everything instead of scaling out
Going from 100% to 0% in one trade means you'll either sell too early (and watch the price run) or too late (and lock in a lower price). Scaling out across multiple price levels averages your exit and reduces regret.
How Social Signals Add Context to Technical Analysis
Technical indicators tell you what the chart is doing. Social signals tell you what other traders are doing. Combining both creates a more complete picture.
For example, if RSI is rolling over from overbought levels and you can see that top-performing traders are already selling, that's two independent sources of confirmation.
This is where a platform like fomo becomes useful. fomo overlays buy and sell actions from other traders directly on the price chart, so you can see whether profitable traders are trimming positions during the same technical setups you're watching. The app's leaderboard shows the most profitable traders across 24-hour, 7-day, and 30-day windows, and you can follow their activity with real-time notifications.
It's not about blindly copying someone else's exit. It's about adding a social confirmation layer to the technical signals you already know. When chart signals and trader behavior align, you can sell with more confidence.
FAQ
What RSI level signals it's time to sell crypto?
An RSI reading above 70 indicates overbought conditions, but the actual sell signal comes when RSI drops back below 70. That reversal means buying momentum is fading. In very strong trends, RSI can remain elevated, so combine it with volume analysis or MACD for stronger confirmation.
How does a MACD bearish crossover work?
A bearish crossover occurs when the MACD line crosses below the signal line. This indicates that short-term momentum is weakening relative to the longer-term trend. It's most significant when it happens above the zero line, meaning the asset was in an established uptrend before momentum shifted.
Can Bollinger Bands tell you when to sell?
Yes. When price touches or pierces the upper Bollinger Band and then closes back inside the bands, it suggests the rally may be overextended. This "upper rejection" is an early warning — not a standalone sell trigger, but a reason to watch other indicators closely and tighten your risk-off level.
What is bearish divergence and why does it matter?
Bearish divergence occurs when price makes a higher high while a momentum indicator like RSI or MACD makes a lower high. It signals that the strength behind a price move is fading even though the price itself is still rising. It frequently precedes meaningful pullbacks or trend reversals.
Should you sell all your crypto at once or ladder out?
Laddering out — selling in portions at different price levels — is generally the smarter approach. It removes the pressure of timing a perfect exit, averages your sell price, and keeps you partially exposed in case the trend continues. Many experienced traders sell in 25% increments as signals accumulate.
What is the biggest mistake when taking crypto profits?
Waiting for the perfect top. The difference between selling at 90% of the peak and catching the exact top is marginal. The difference between selling at 90% and holding through a 50% crash is enormous. A planned exit at a "good enough" price will always outperform an unplanned one.
How do you combine multiple indicators for a sell decision?
Use the confluence approach: treat each indicator as an independent vote. One signal means stay alert. Two signals mean start trimming. Three or more mean sell aggressively. No single indicator is reliable on its own in crypto's volatile conditions — the power is in confirmation across multiple tools.
Does market cycle stage affect when to sell?
Absolutely. Late-stage bull markets produce the most euphoric price action *and* the highest concentration of sell signals. If broader cycle indicators (like Bitcoin dominance declining, funding rates spiking, or mainstream media coverage surging) align with your technical signals, the case for taking profits becomes even stronger.
Key Takeaways
- Always have an exit plan before you buy. Decide which signals will trigger your sell.
- RSI dropping below 70 after being overbought is your momentum warning shot.
- MACD bearish crossovers above zero confirm that trend momentum is reversing.
- Bollinger Band rejections and bearish divergence catch exhaustion before the crowd sees it.
- Declining volume on new highs is often the earliest signal that a rally is fading.
- Confluence wins. Two or more signals firing together dramatically increases confidence in taking profits.
Disclaimer
This article is for educational purposes only and does not constitute financial advice. Cryptocurrency trading involves substantial risk, and you should never trade with money you cannot afford to lose. Technical indicators are probabilistic tools — they improve decision-making but do not guarantee outcomes. Always conduct your own research before making any trading decisions.