Support and Resistance: The Foundation of Every Crypto Trade
fomoMay 20, 2026

Introduction
Every crypto chart tells a story — and the plot always revolves around the same two characters: support and resistance. These are the price levels where buyers and sellers repeatedly clash, and learning to read them is arguably the single most useful skill a crypto trader can develop.
Whether you're trading Bitcoin, Ethereum, or the latest memecoin that's trending on your feed, support and resistance give you a framework for deciding where to enter, where to exit, and where to place your risk-off level. Without them, you're essentially trading blind.
This guide breaks down what support and resistance are, how to find them on a chart, the three core setups every trader should know, and the mistakes that trip up beginners — all in plain language with real chart examples.
TL;DR
Support and resistance are horizontal price zones where crypto prices tend to stall or reverse. Support is where buyers step in; resistance is where sellers take over. Learning to identify these levels helps you plan better entries, smarter exits, and tighter risk management. This guide covers the three essential setups — the bounce, the rejection, and the flip — so you can start using them in your next trade.
What Is Support and Resistance?
Support is a price level where a crypto asset tends to stop falling. It's where buying pressure is strong enough to absorb sell orders and push price back up. Think of it as a floor.
Resistance is the opposite — a price ceiling where selling pressure overwhelms buyers and pushes price back down.
These levels form because markets have memory. If a token rallied hard from $1.00 and never looked back, that $1.00 level represents unfinished business — an area where buyers showed up in force and may show up again. The most powerful support and resistance levels are the ones that haven't been tested yet. A previous high that was set and never revisited, or a previous low that price bounced from and left behind — these untested levels carry the most stored energy because the orders around them have never been consumed.
Key distinction: Support and resistance are zones, not exact lines. A support level at $60,000 might actually represent a range from $59,500 to $60,200 where buying activity clusters. Drawing a thick zone rather than a thin line will save you from many false signals.
| Support | Resistance | |
|---|---|---|
| What it is | Price floor | Price ceiling |
| Driven by | Buying pressure | Selling pressure |
| Signals | Potential bounce / entry | Potential rejection / exit |
| When broken | Becomes resistance | Becomes support |
How to Find Support and Resistance on a Crypto Chart
Finding these levels is simpler than most guides make it seem. Here's a straightforward three-step process:
Step 1: Zoom out
Switch to a higher timeframe (4-hour or daily) to see the big picture. Higher-timeframe levels are stronger and more reliable than levels on 1-minute or 5-minute charts.
Step 2: Identify reaction points
Look for areas where price has previously reversed or stalled. But here's the nuance most guides get wrong: a level does not get stronger with more touches. Each test consumes the buy or sell orders sitting at that level, which means the first test of a new level tends to produce the strongest reaction. By the third or fourth touch, much of the liquidity has been absorbed and the level is more likely to break than hold.
Step 3: Draw zones, not lines
Use horizontal shaded areas rather than thin lines. This accounts for the natural noise in crypto price action, especially on volatile tokens.
Common tools that help: horizontal lines on any charting app, volume profile (shows where trading activity concentrates), and Fibonacci retracement levels for additional confluence.
The Three Setups Every Crypto Trader Should Know
These are the three most common ways traders use support and resistance levels. Each one is illustrated below.
Setup 1: The Bounce (Buying at Support)
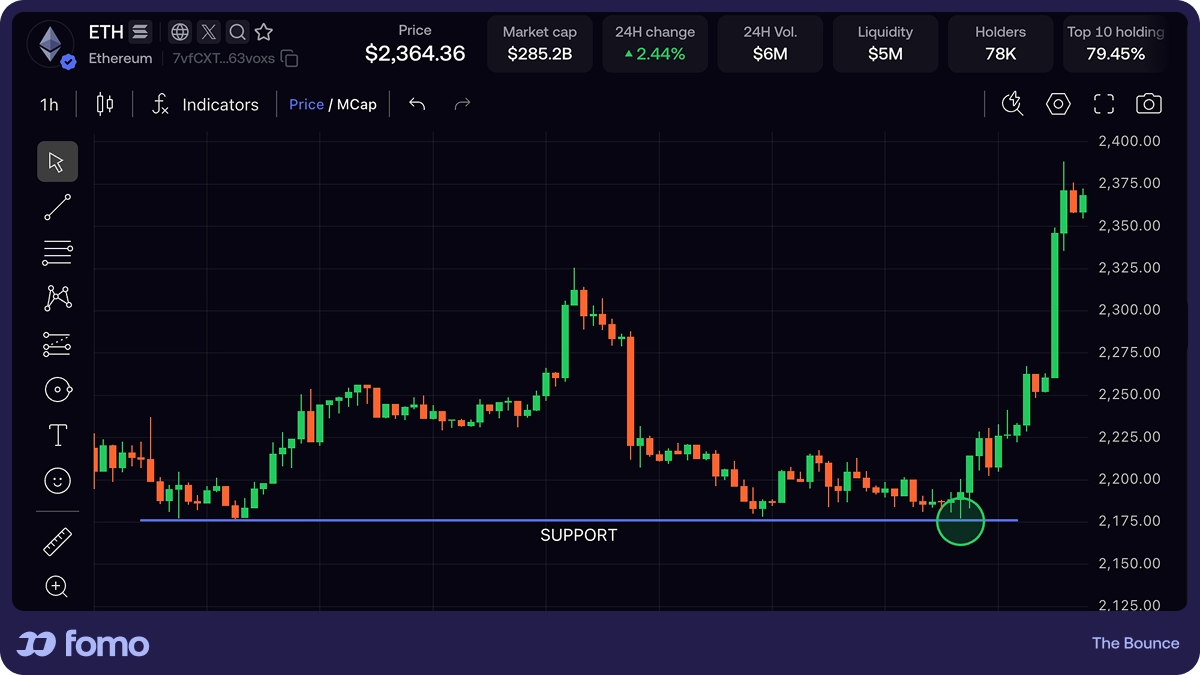
This is the most intuitive setup. Price falls toward a known support zone, shows signs of holding (wicks, smaller candles, buying volume), and you enter long with a risk-off level just below the zone.
The key insight most guides miss: The highest-probability bounce happens at a level that has never been retested. For example, imagine a token that made a sharp low at $2.00 back in January, rallied to $4.00, and is now pulling back for the first time toward that $2.00 area. That original low was a place where buyers stepped in aggressively — and because price never came back to test it, all that buying interest is still "stored" there. That first retest is your strongest setup. By contrast, a level that has already bounced three or four times has had its liquidity consumed with each visit and is far more likely to break.
Where to look for areas of support or resistance:
- Previous support or resistance zones — Look for areas on the chart where price has clearly reacted in the past — a visible bounce off a floor or a sharp rejection at a ceiling. These are levels where buying or selling pressure made itself obvious. If price moved away from that zone and hasn't returned, it's untested, and the orders from that original reaction haven't been consumed.
- Prior swing highs and lows within a trend — This is where trend structure adds context. In an uptrend, price makes a series of higher highs and higher lows. Each higher low is a swing low — the specific point where a pullback ended and buyers retook control. An untested swing low in an active uptrend is one of the highest-quality support levels you can find, because you're trading in the direction of the trend at a level where buyers already proved they're willing to step in. In a downtrend, the mirror applies: price makes lower highs and lower lows. Each lower high is a swing high — where a rally failed and sellers regained control. An untested swing high in an active downtrend is equally powerful as resistance, because you're trading with the trend at a level where sellers already showed dominance.
- Previous breakout and breakdown points — In a bullish breakout, a level that used to act as resistance gets broken to the upside. That old resistance is now potential support if price pulls back to it — and if it hasn't been retested yet, it carries the conviction of the breakout buyers who want to defend their entry. In a bearish breakdown, the reverse applies: a level that used to act as support gets broken to the downside, and that old support becomes potential resistance if price rallies back up to it, as trapped buyers look to exit at breakeven.
How to trade it:
- Identify a support zone using the types above — ideally one that has not yet been retested
- Wait for price to enter the zone — don't front-run it
- Look for confirmation: bullish candlestick patterns (hammer, engulfing), a spike in buying volume, or a strong wick rejection
- Enter your position and set your risk-off level just below the support zone
What about levels that have already been tested? They can absolutely still work — a level that has bounced twice or three times is not worthless. But treat it as a spectrum: the first test has the highest probability of a strong reaction, and each additional test consumes some of the resting orders at that level. If you're trading a level that's been tested several times, tighten your risk-off level, reduce your position size, and demand stronger confirmation before entering. The level may hold — but if it doesn't, the break can be fast.
Why untested levels work best: When price reacts sharply at a level and moves away, the orders that drove that move were filled — that's what caused the reaction. But on strong moves, some buyers are often left behind — orders that didn't get filled, or traders who wanted to buy more but didn't get the chance. When price eventually comes back to that level, those leftover buyers defend their position, and new traders who watched the original move see it as the entry they had originally wanted. That combination of old conviction and fresh interest is what makes first tests so powerful.
Setup 2: The Rejection (Selling at Resistance)
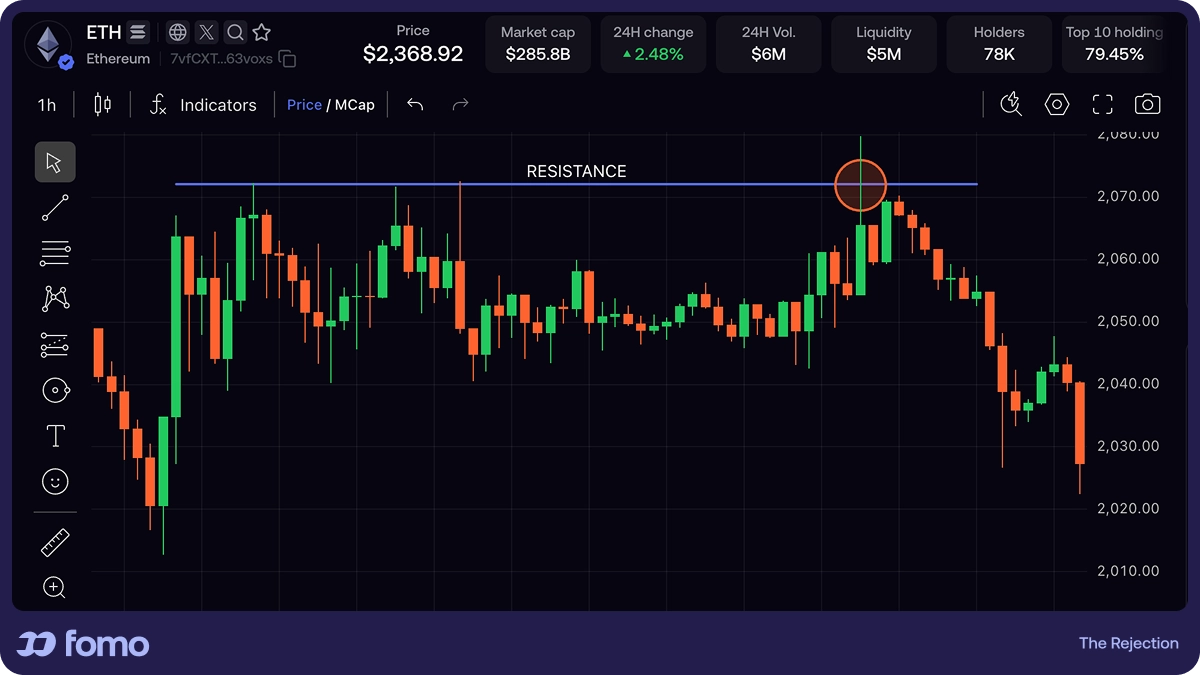
This is the mirror image. Price rallies into a resistance zone and gets rejected.
How to trade it:
- Identify a resistance zone that price has not yet retested — a previous high that was set and abandoned, an old swing high within a downtrend, or an old support level that broke and hasn't been revisited from below
- Watch for bearish signals as price enters the zone: long upper wicks, bearish engulfing candles, declining volume on the push higher
- Consider taking profit on existing positions or opening a short with a risk-off level above the resistance zone
What about resistance that's been tested before? Same principle as support — a level that's been rejected two or three times can still produce a reaction. But the odds decrease with each test, so adjust accordingly: tighter risk-off levels, smaller size, and stronger confirmation requirements.
Pro tip: Weakening reactions at resistance (each rejection is smaller than the last) are a warning sign that the level is about to break. Experienced traders watch for this pattern to position for breakouts, not rejections.
Setup 3: The Flip (When Support Becomes Resistance — and Vice Versa)
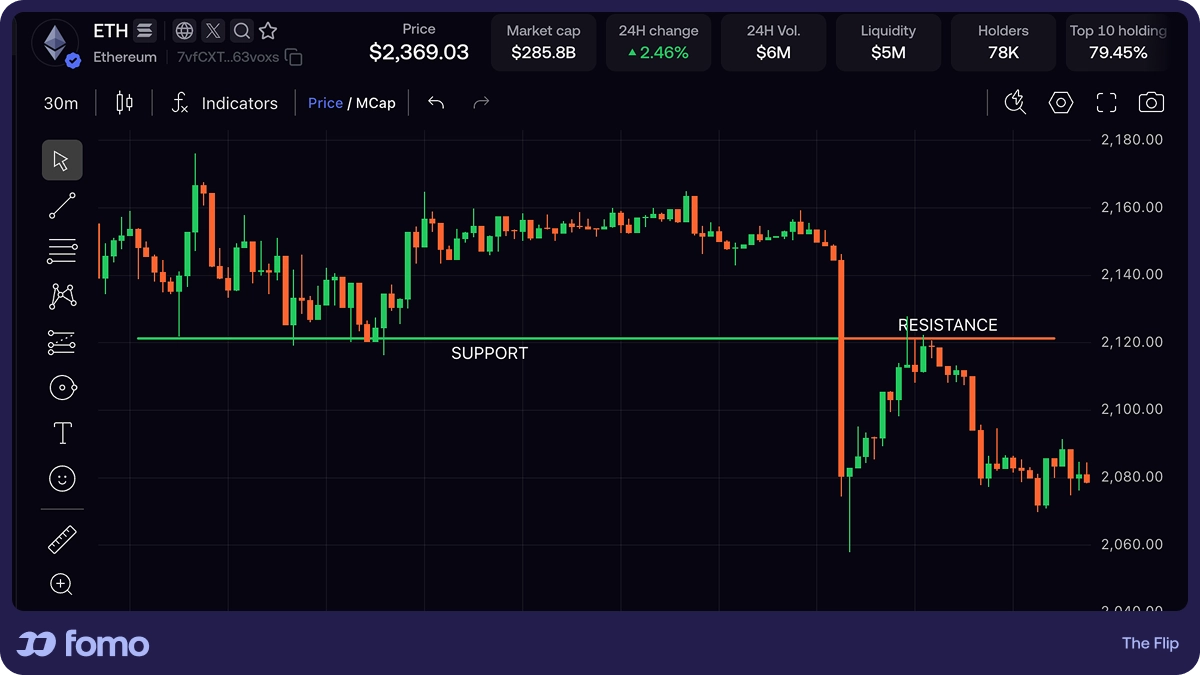
This is the setup that separates beginners from experienced traders — and it ties everything together. When a support level breaks, it often flips and becomes resistance. When a resistance level breaks, it often flips and becomes support. The untested-level principle is what makes the flip so powerful: a level that has been tested repeatedly will eventually break as its liquidity is consumed. Once it breaks, the retest from the other side is effectively a first test of that level in its new role — making it high probability.
The bearish flip (support becomes resistance): Traders who bought at the old support are now underwater. When price rallies back to that level, many of them sell to break even, creating sell pressure right at the old support. Because this is the first time the level is acting as resistance, that selling pressure hasn't been consumed yet.
The bullish flip (resistance becomes support): Traders who sold or took profit at the old resistance watch it break. When price pulls back to that level, new buyers see the former ceiling as a logical entry, and breakout traders add to their positions. The old resistance becomes a floor — and the first test from above tends to hold.
How to trade it:
- A level breaks decisively (strong candle close beyond it, not just a wick)
- Price pulls back to retest the broken level from the other side
- The retest gets rejected — confirming the flip
- For a bearish flip: enter short or avoid buying, with a risk-off level above the new resistance zone
- For a bullish flip: enter long, with a risk-off level below the new support zone
Why Support and Resistance Matter Even More in Crypto
Crypto markets run 24/7 with higher volatility than traditional markets. That makes support and resistance levels more important, not less, for several reasons:
- No closing bell. Without market hours, key levels are the primary structural anchors traders use to orient themselves.
- Liquidity clusters. In crypto, especially for memecoins and smaller tokens, liquidity is thinner. Support and resistance zones represent liquidity clusters where large orders accumulate — they're the zones where you can actually get filled.
- Social amplification. When traders share the same levels on social feeds, those levels attract more attention and more orders, reinforcing their strength.
This is where a social trading environment adds real value. Seeing what other traders are buying or selling at a particular price level — and whether those positions are profitable — gives you a real-time read on how much conviction exists at support or resistance. On platforms like fomo, you can see other traders' buy and sell actions overlaid directly on price charts, follow top traders to see when they're entering at key levels, and track per-coin social feeds that show every buy, sell, and thesis in one place.
That kind of transparency turns support and resistance from a solo charting exercise into a social signal.
Common Mistakes to Avoid
Assuming a level gets stronger with more touches
This is the most widespread misconception in trading education. Each test consumes some of the orders sitting at a level, so the first test tends to be the strongest reaction. That doesn't mean a multi-tested level can't hold — it absolutely can — but the probability decreases with each visit. Treat it as a spectrum: untested levels deserve the most confidence, and well-tested levels demand more caution, tighter risk-off levels, and stronger confirmation.
Treating levels as exact prices
Support at $1.00 doesn't mean price will bounce at exactly $1.0000. Use zones.
Ignoring timeframes
A support level on a 5-minute chart is far weaker than one on a daily chart. Always check higher timeframes first.
Fighting the break
When a support level breaks with conviction (strong volume, large candle body), don't keep buying the dip. Recognize the flip.
Using too many levels
If your chart has 15 lines on it, none of them are useful. Stick to the two or three most significant levels for your timeframe.
Skipping confirmation
Entering a trade just because price touched support is like catching a falling knife. Wait for a reaction — a wick, a candle pattern, a volume shift — before committing.
Quick Checklist: Trading Support & Resistance
✅ Identified the level on a higher timeframe (4H / Daily)
✅ Level is untested — price reacted there before but hasn't revisited it yet (first test = strongest)
✅ Drawn as a zone, not a thin line
✅ Waited for confirmation (wick rejection, candle pattern, volume)
✅ Set a risk-off level just beyond the zone
✅ Checked what other traders are doing at this level (social signals)
✅ Position sized appropriately — no single trade should risk more than 1-2% of your account
FAQ
What is support and resistance in crypto trading?
Support is a price zone where buying interest tends to prevent further decline. Resistance is a zone where selling pressure tends to cap upward movement. Together, they form the backbone of technical analysis and help traders plan entries, exits, and risk management.
Are support and resistance zones or exact lines?
Zones. Price rarely reverses at a single exact price. It's more useful to draw a shaded area that covers the cluster of reactions, typically spanning a small percentage range around the key level.
What timeframe should I use?
Start with daily or 4-hour charts to identify the most meaningful levels. You can then drop to lower timeframes (1H, 15m) to fine-tune entries, but higher-timeframe levels carry more weight.
Do support and resistance work for memecoins?
Yes, though levels on newer tokens have less historical data and are therefore less reliable. Focus on levels with strong volume and multiple touches. Social signals — like seeing many traders buying at the same zone — can help confirm memecoin support levels.
What happens when a support level breaks?
It often becomes resistance. This "flip" is one of the most powerful setups in trading. Traders who bought at the old support become sellers when price retests the level from below, creating natural selling pressure.
How many support and resistance levels should I draw?
Less is more. Identify two to three key levels on your primary timeframe. Too many lines creates noise and makes it harder to make decisions.
Can I rely on support and resistance alone?
They're strongest when combined with other signals: volume, candlestick patterns, trend direction, and social activity from other traders. No single tool is a complete strategy by itself.
How do I know if a breakout is real or fake?
Look for volume confirmation — real breakouts typically come with a significant increase in volume. A breakout on thin volume is more likely a fakeout. Waiting for a candle to close beyond the level (not just wick through) also improves reliability.
Key Takeaways
- Support is a price floor driven by buying pressure; resistance is a ceiling driven by selling pressure
- Always draw zones, not exact lines — crypto is too volatile for precision
- The strongest levels are untested ones — old highs or lows where price reacted and never came back. When price finally revisits them, that first test produces the most reliable reaction
- Each subsequent test of a level weakens it as resting orders get consumed — don't assume more touches means stronger
- The three core setups: the bounce (buy at untested support), the rejection (sell at untested resistance), and the flip (broken support becomes resistance, broken resistance becomes support — both are fresh levels on the other side)
- Higher-timeframe levels are stronger and more reliable
- Wait for confirmation before entering — don't front-run levels
- Social trading signals (seeing what others buy/sell at key levels) add a valuable information layer
- Keep your charts clean — two to three key levels is enough
- Always set a risk-off level just beyond the zone to protect your capital
This article is for educational purposes only and does not constitute financial advice. Crypto trading involves significant risk, and you should only trade with funds you can afford to lose. Always do your own research before making any trading decisions.