What Is Market Structure in Trading? The Framework That Changes Everything
fomoMay 20, 2026

Every chart is telling you something. The question is whether you can read it.
Most traders start their journey stacking indicators — RSI, MACD, moving averages — hoping the lines will tell them what to do. But beneath every indicator is something more fundamental: the raw movement of price itself, swinging between highs and lows in a pattern that reveals who is in control — buyers or sellers.
That pattern is called market structure. And once you learn to see it, trading stops feeling like guesswork.
This guide breaks down what market structure is, how to identify the three core types, the key signals that tell you when a trend is continuing or reversing, and how to apply it all — whether you trade stocks, forex, or crypto.
TL;DR
Market structure is the sequence of swing highs and swing lows on a price chart that tells you the trend direction. There are three types: bullish (higher highs, higher lows), bearish (lower highs, lower lows), and ranging (sideways). Key signals like Break of Structure (BOS) and Change of Character (CHoCH) tell you whether a trend is continuing or reversing. Master this framework, and every other trading skill — entries, exits, risk management — becomes clearer.
What Is Market Structure? A Clear Definition
Market structure is the framework of swing highs and swing lows that defines the current trend direction of any traded asset
It tells you, at a glance, whether buyers or sellers are in control — and whether that control is strengthening, weakening, or shifting.
Think of it like reading a topographic map before hiking. You wouldn't walk into the mountains without understanding the terrain. Market structure is the terrain of price.
At its core, you only need to understand two elements:
- Swing highs: peaks where price reversed downward after an upward push.
- Swing lows: valleys where price reversed upward after a downward push.
The relationship between consecutive swing highs and swing lows tells you everything about the current trend. No indicators required.
The Three Types of Market Structure
Every market, on every timeframe, is doing one of three things. Your job is to identify which one.
Bullish Market Structure (Uptrend)
A bullish structure is defined by higher highs (HH) and higher lows (HL). Each rally pushes beyond the previous peak, and each pullback holds above the previous valley. Buyers are in control, and each dip is met with demand.
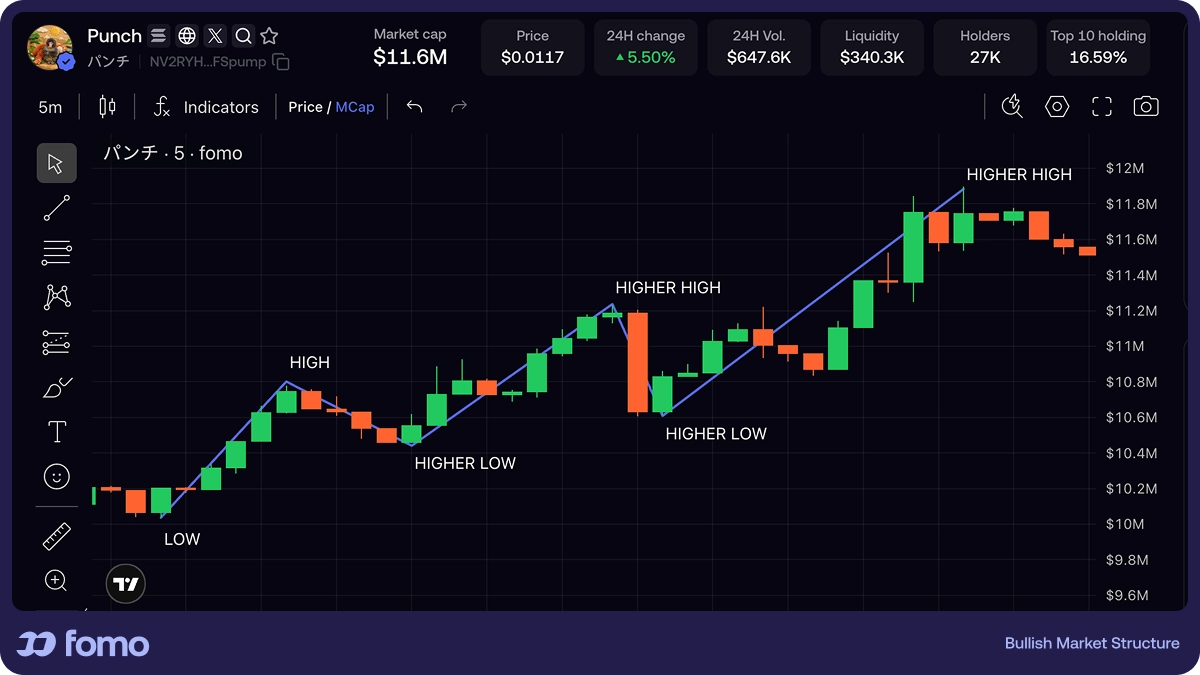
What to look for: As long as price keeps making higher lows, the bullish structure is intact. The moment a higher low fails — that's your first warning sign.
Bearish Market Structure (Downtrend)
A bearish structure is the mirror image: lower highs (LH) and lower lows (LL). Each bounce fails to reach the prior peak, and each drop cuts below the previous valley. Sellers are in control.
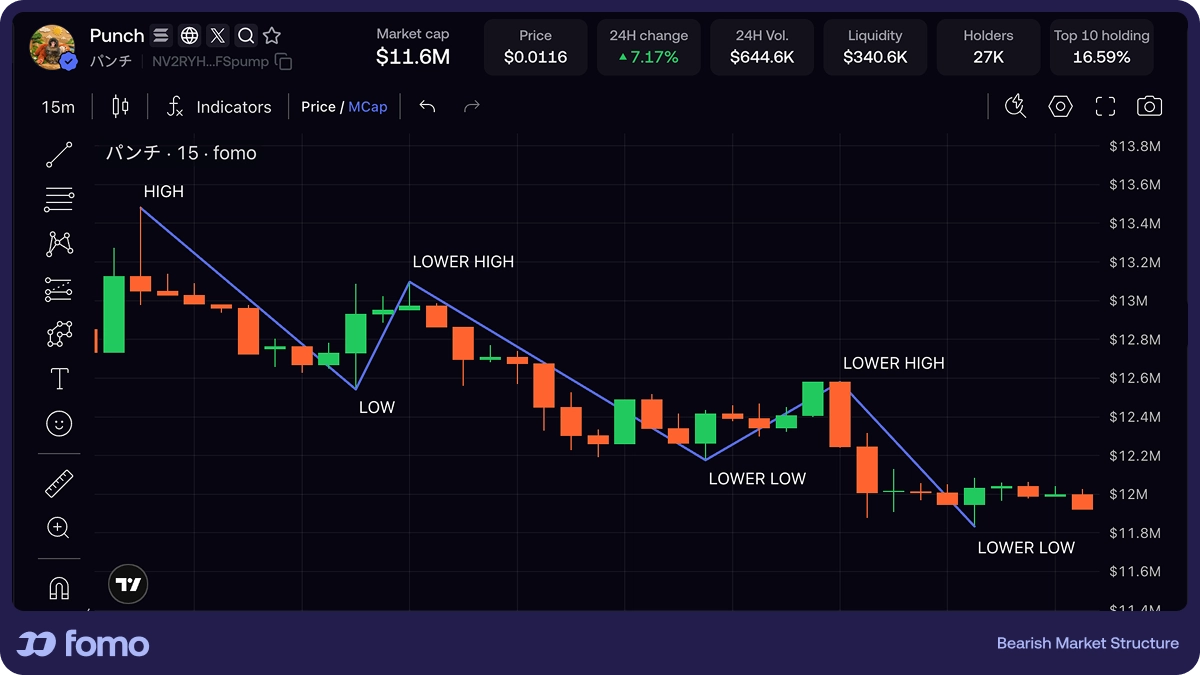
What to look for: The bearish structure remains valid as long as price keeps printing lower highs. A higher high is the first sign of potential reversal.
Ranging Market Structure (Consolidation)
When price stops making directional progress, it enters a range. Price bounces between a roughly horizontal support level and resistance level, and neither buyers nor sellers can establish control.
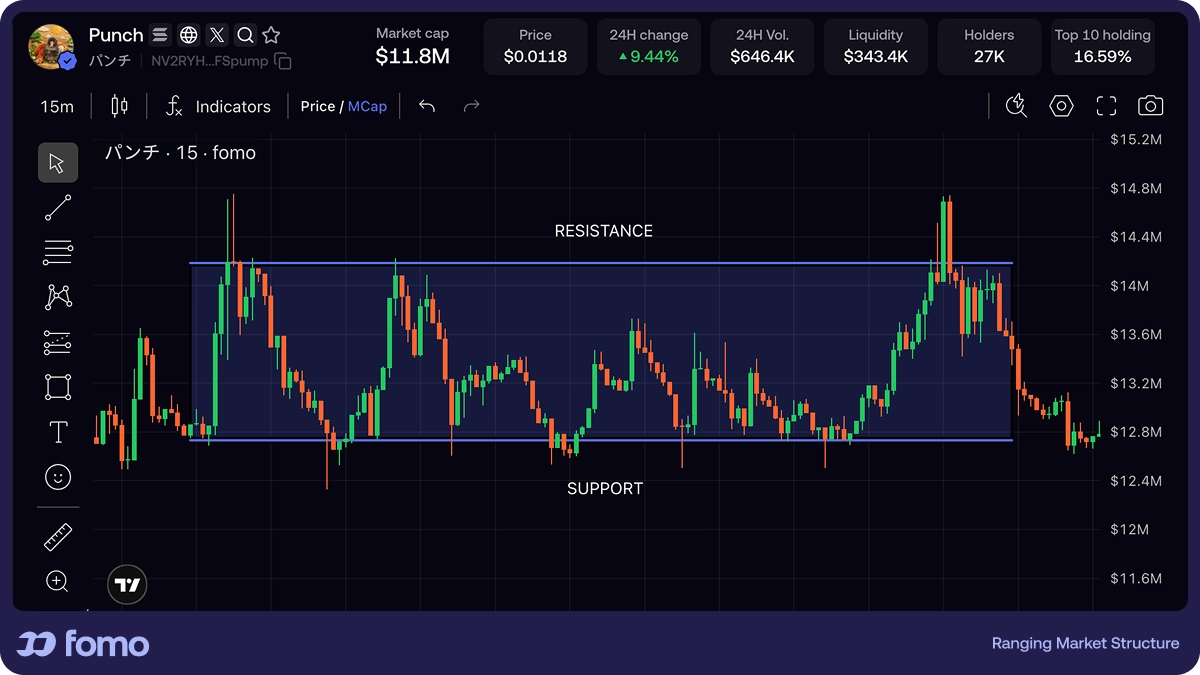
What to look for: Ranges are where liquidity builds. The eventual breakout (or breakdown) from a range often produces the strongest moves.
Key Market Structure Signals Every Trader Should Know
Identifying structure type is step one. The next level is recognizing when structure changes. Two signals matter most.
Break of Structure (BOS)
A BOS confirms that the current trend is continuing. In a bullish trend, a BOS happens when price breaks above the most recent swing high. In a bearish trend, it happens when price breaks below the most recent swing low.
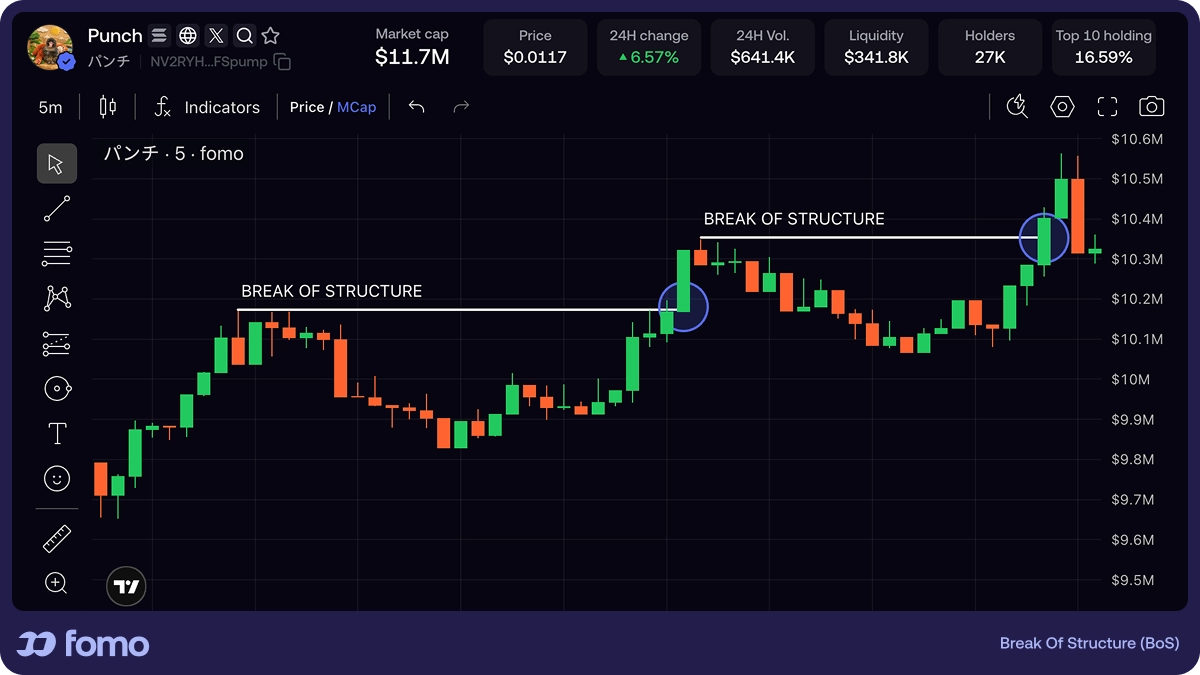
A BOS tells you: "The trend is alive. Expect continuation."
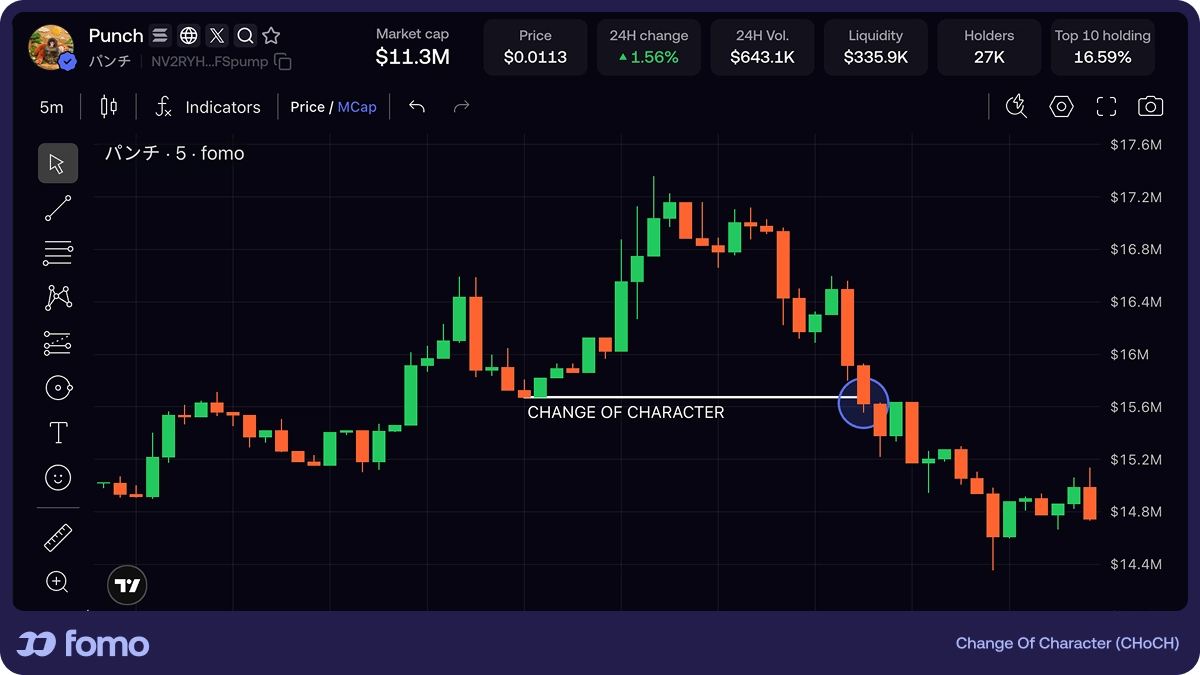
Change of Character (CHoCH)
A CHoCH, also known as a market structure shift, is the first signal that a trend may be reversing. In a bullish trend, a CHoCH occurs when price fails to make a new higher high and then breaks below the most recent higher low. It's the market "changing character" from bullish to bearish — or vice versa. A CHoCH tells you: "Control may be shifting. Pay attention."
How to Read Market Structure: A Step-by-Step Process
Reading market structure is a skill, not a secret. Here's a repeatable five-step process you can apply to any chart.
Step 1: Identify Swing Highs and Swing Lows
Look at the chart and mark the obvious peaks and valleys. Don't overthink it — focus on the swings that are clearly visible at your chosen timeframe.
Step 2: Determine the Current Trend
Are the highs getting higher and the lows getting higher? That's bullish. Are both getting lower? Bearish. Neither? You're in a range.
Step 3: Map Key Levels
Mark the most recent swing high and swing low. These are your key structural levels — the lines in the sand that, if broken, signal a change.
Step 4: Watch for BOS or CHoCH
Once you have your levels mapped, watch how price interacts with them. A break above the high (in an uptrend) = BOS. A break below the low = CHoCH.
Step 5: Confirm with a Higher Timeframe
Whatever structure you see on your trading timeframe, check one timeframe higher. If both align, you have a higher-probability setup. If they conflict, proceed with caution.
Multi-Timeframe Analysis: Seeing the Bigger Picture
Market structure is fractal — the same pattern of highs and lows repeats on every timeframe. A trend on the daily chart is made up of smaller trends on the hourly chart, which in turn contain even smaller trends on the 15-minute chart.
This is why multi-timeframe analysis matters. The higher timeframe gives you direction (are we bullish or bearish overall?). The lower timeframe gives you precision (where exactly should I enter?).
A common approach: use the 4-hour or daily chart for trend direction, and the 1-hour or 15-minute chart for entry timing. If the higher timeframe is bullish and the lower timeframe just printed a BOS to the upside, that's alignment — and alignment is where the highest-probability trades live.
Market Structure in Crypto: Why It Matters Even More
Everything above applies to crypto — but with an important twist. Crypto markets are open 24/7, more volatile, and heavily influenced by social sentiment. Structure shifts can happen faster, and they're often triggered by visible crowd behavior: a whale buying, a meme going viral, or a wave of traders piling into the same token.
This is where having access to real-time social data becomes a significant edge. On fomo, for example, you can see what tokens top traders are buying and selling, view their trades overlaid directly on the price chart, and follow traders to get instant notifications when they act. That kind of visibility means you're not waiting to identify a structure shift after the fact — you can see the activity that often precedes it.
Common Market Structure Mistakes (and How to Avoid Them)
1. Picking the wrong swing points
Not every minor wick is a swing point. Focus on the swing highs and lows that are clearly visible on your chosen timeframe. If you have to squint, it's probably noise.
2. Trading internal structure against the larger trend
Lower-timeframe structure can tempt you into counter-trend trades. Always check the higher timeframe first.
3. Ignoring the higher timeframe
A bullish BOS on the 5-minute chart means very little if the daily chart is in a clear downtrend.
4. Placing your risk-off level inside the structure
Your risk-off level should be placed beyond the structural level that would invalidate your trade — not inside it. If the level you're leaning on gets broken and your risk-off level was above it, you'll get stopped out by normal market noise.
5. Chasing a BOS without waiting for a retest
After a break of structure, price often pulls back to retest the broken level. Patient traders wait for that retest; impatient ones chase the breakout and end up buying at the worst price.
✅ Pre-Trade Checklist Before you enter any trade, ask yourself: - Have I identified the current market structure? - Does the higher timeframe support my direction? - Am I waiting for a BOS or reacting to a CHoCH? - Is my risk-off level placed beyond the invalidation point? - Am I chasing, or am I waiting for a retest? If you can't answer "yes" to all five, don't trade. Patience is structure.
| Myth | Fact |
|---|---|
| Market structure only works in Forex. | It applies to any liquid market: stocks, crypto, commodities, indices. |
| You need indicators to confirm structure. | Market structure is pure price action. Indicators are optional supplements. |
| A single candle wick above a high = BOS. | Most experienced traders require a candle body close beyond the level to confirm a BOS. |
| Market structure guarantees trade outcomes. | No framework is 100% accurate. Structure improves probability, not certainty. |
Who Market Structure Is For (and Who It's Not For)
Great for: Day traders, swing traders, crypto traders, anyone learning to read price action, and traders who want a rules-based framework for entries and exits.
Not ideal for: Ultra-high-frequency algorithmic strategies that operate on millisecond timescales, or long-term investors whose decisions are purely based on fundamentals.
If you're in the crypto space and want a more social, real-time way to apply market structure, fomo combines trading with a live social feed. You can see per-coin timelines showing every buy, sell, and thesis from other traders — giving you instant context on market sentiment alongside the structure you're reading on the chart.
Frequently Asked Questions
What is market structure in trading?
Market structure is the pattern of swing highs and swing lows on a price chart that defines trend direction. It tells you whether a market is in an uptrend (higher highs and higher lows), a downtrend (lower highs and lower lows), or a range (sideways movement). It's the foundation of price action analysis.
What are the three types of market structure?
The three types are bullish (uptrend), bearish (downtrend), and ranging (consolidation). Bullish structure features higher highs and higher lows. Bearish structure features lower highs and lower lows. Ranging structure shows price moving sideways between support and resistance with no clear directional bias.
What is a Break of Structure (BOS)?
A BOS is a confirmation that the current trend is continuing. In an uptrend, it occurs when price breaks above the most recent swing high. In a downtrend, it occurs when price breaks below the most recent swing low. It signals that the dominant side (buyers or sellers) still has control.
What is a Change of Character (CHoCH)?
A CHoCH is an early warning signal that a trend may be reversing. It occurs when price breaks a key structural level in the opposite direction — for example, breaking below the most recent higher low during an uptrend. It signals a potential shift in control from buyers to sellers or vice versa.
What timeframe is best for market structure?
There's no single "best" timeframe. Many traders use the 1-hour or 4-hour chart for structure analysis and drop to the 15-minute chart for entries. The key principle is multi-timeframe alignment: your trading timeframe structure should match the direction of the higher timeframe.
Can market structure be used in crypto trading?
Absolutely. Market structure applies to any liquid, charted market. Crypto is particularly well-suited because its 24/7 nature and high volatility produce clear structural patterns. Social signals and crowd behavior can accelerate structure shifts, making real-time data tools especially valuable.
What is the biggest mistake traders make with market structure?
The most common mistake is picking the wrong swing points — usually by zooming in too far and reacting to minor noise rather than meaningful structural levels. The solution is to always start with a higher timeframe and only mark swings that are clearly visible.
How does market structure differ from price action?
Market structure is a specific component of price action. Price action is the broader discipline of reading raw price movement (candlestick patterns, volume, momentum). Market structure is specifically the framework of highs and lows that tells you the trend direction. Think of structure as the map; price action is everything that happens on the terrain.
Key Takeaways
- Market structure is the sequence of swing highs and swing lows that defines trend direction — it's the foundation of reading any chart.
- Three types: bullish (higher highs/higher lows), bearish (lower highs/lower lows), and ranging (sideways).
- BOS confirms trend continuation; CHoCH (also called a market structure shift) signals a potential reversal.
- Always use multi-timeframe analysis — structure on a lower timeframe only matters if it aligns with the higher timeframe.
- Place your risk-off level beyond the structural invalidation point, not inside it.
- In fast-moving markets like crypto, real-time social signals (like those on fomo) add a layer of context that traditional chart analysis alone can't provide.
- No framework is perfect. Market structure improves your probability — not your certainty. Always manage risk.
Disclaimer: This article is for educational purposes only and does not constitute financial advice. Trading involves significant risk of loss. Past performance does not guarantee future results. Always do your own research and consult a qualified financial advisor before making trading decisions.