Crypto Chart Patterns: The 15 Patterns That Actually Matter
fomoMay 20, 2026

There are hundreds of chart patterns in the technical analysis playbook. If you tried to learn every single one, you'd spend more time studying than trading. The truth is, most crypto traders only need about 15 patterns to navigate the market effectively.
This guide cuts through the noise. Instead of an exhaustive encyclopedia, we've curated the 15 crypto chart patterns that consistently appear in Bitcoin, altcoin, and memecoin markets — ranked by category, explained in plain language, and paired with a practical framework for actually trading them. Whether you're reading your first candlestick chart or refining an existing strategy, these are the patterns worth your time.
TL;DR: Crypto chart patterns fall into three categories: reversal (signals a trend change), continuation (signals a trend will resume), and bilateral (could break either way). This guide covers the 15 most reliable patterns for crypto traders, explains how to confirm them with volume and timeframe analysis, and walks through each pattern with chart examples. It's built for beginner-to-intermediate traders who want a practical framework — not a 200-page textbook.
What Are Crypto Chart Patterns?
Crypto chart patterns are recurring visual formations on price charts that reflect the collective psychology of buyers and sellers. They form when price action creates recognizable shapes — like triangles, flags, or double peaks — that have historically preceded specific market moves. Traders use them to anticipate potential breakouts, reversals, or trend continuations.
These patterns aren't unique to crypto. They originate from decades of stock market technical analysis and are rooted in crowd behavior: fear, greed, indecision, and momentum. The reason they apply to cryptocurrency is simple — the same human emotions drive both markets.
That said, crypto chart patterns do behave a bit differently than their stock-market counterparts. Crypto markets run 24/7 with no closing bell, which means patterns can form and resolve faster. Volatility is higher, so price swings within patterns tend to be wider. And because many altcoins and memecoins have lower liquidity, false breakouts are more common.
The three categories of chart patterns:
Every pattern falls into one of three groups. Understanding which category a pattern belongs to tells you what kind of move to expect.
- Reversal patterns signal that the current trend is losing steam and may change direction. They appear at the end of uptrends or downtrends.
- Continuation patterns suggest the prevailing trend is taking a breather and will likely resume. They form during brief consolidation phases within a larger trend.
- Bilateral patterns indicate indecision — the price could break in either direction. Traders watch these closely and let the breakout decide the bias.
Do Chart Patterns Actually Work in Crypto?
Short answer: yes, but with important caveats.
Chart patterns work because of a self-fulfilling prophecy effect. When thousands of traders recognize the same head-and-shoulders formation and act on it — selling at the neckline break — their collective behavior makes the predicted outcome more likely. Historical back-testing of common patterns shows measurable statistical tendencies, with certain well-known formations succeeding more often than they fail when properly confirmed.
But patterns are probability tools, not crystal balls. They fail regularly, especially in crypto, where sudden news events, whale-driven market manipulation, regulatory announcements, and cascading liquidations can override even the most textbook setup. Low-liquidity tokens are particularly prone to false breakouts because it takes less capital to push the price through key levels.
The key principle to internalize: chart patterns tilt the odds in your favor. They don't guarantee a specific outcome. The traders who profit consistently from patterns are the ones who combine them with volume confirmation, multi-timeframe analysis, and disciplined risk management.
The 15 Crypto Chart Patterns That Actually Matter
Reversal Patterns
Reversal patterns appear at the end of a trend and signal that momentum is shifting. These are some of the most valuable signals in crypto, where sentiment can flip quickly.
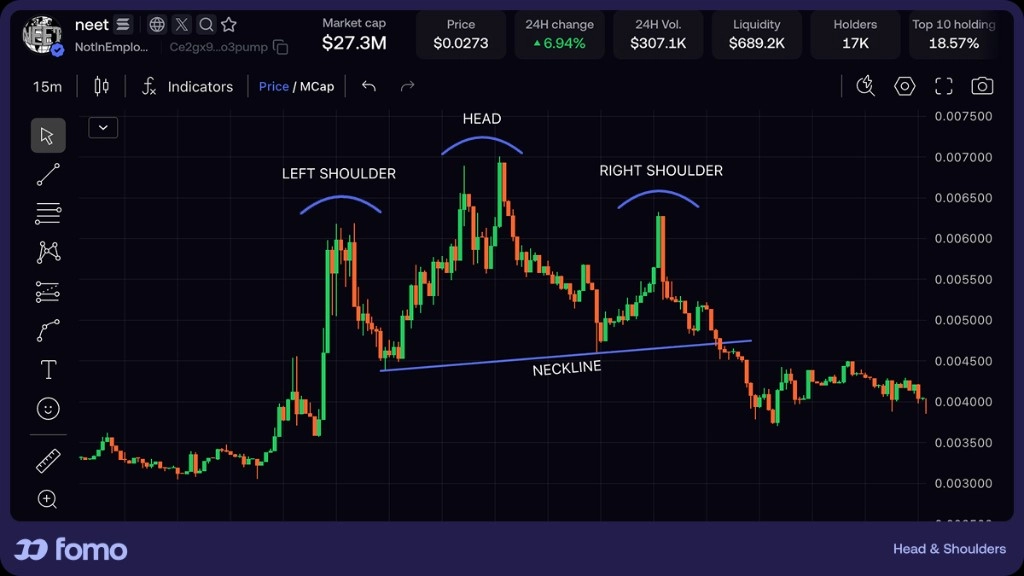
1. Head and Shoulders (Bearish Reversal)
The head and shoulders is one of the most widely recognized reversal patterns. It forms after an uptrend and consists of three peaks: a higher central peak (the head) flanked by two lower peaks (the shoulders). A "neckline" connects the lows between the peaks.
The pattern confirms when the price breaks below the neckline on increasing volume. The expected move is roughly equal to the distance from the head to the neckline, measured downward from the breakout point. In crypto, this pattern is most reliable on 4-hour and daily charts for large-cap assets like Bitcoin and Ethereum, where liquidity supports cleaner formations.
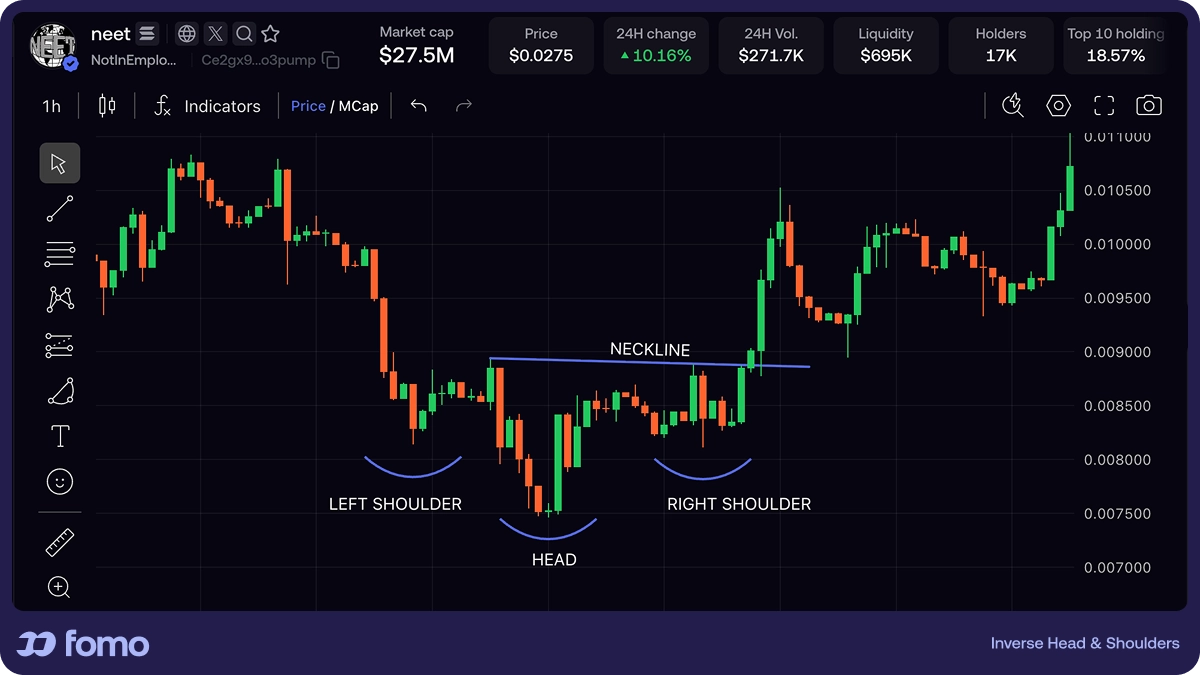
2. Inverse Head and Shoulders (Bullish Reversal)
The mirror image of the standard head and shoulders, this pattern forms at the bottom of a downtrend. Three troughs appear — the middle one deeper than the other two — with a neckline connecting the peaks between them. A breakout above the neckline on strong volume confirms the reversal. This is a high-conviction entry signal for traders looking to catch the beginning of a new uptrend.
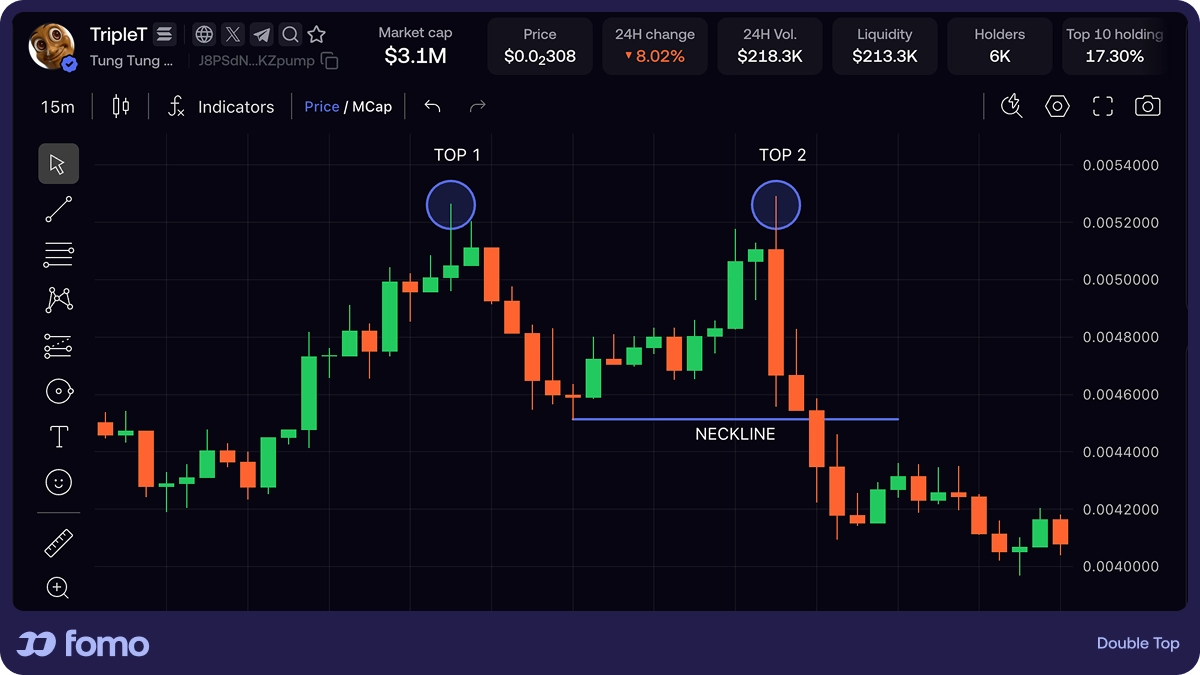
3. Double Top (Bearish Reversal)
Shaped like the letter "M," a double top forms when the price hits the same resistance level twice and fails to break through. The two peaks signal that buyers are losing conviction at that price. A breakdown below the support level between the two peaks (the "neckline") confirms the pattern. Double tops are among the most common reversal patterns in crypto and frequently appear during the transition from a bull run to a correction.
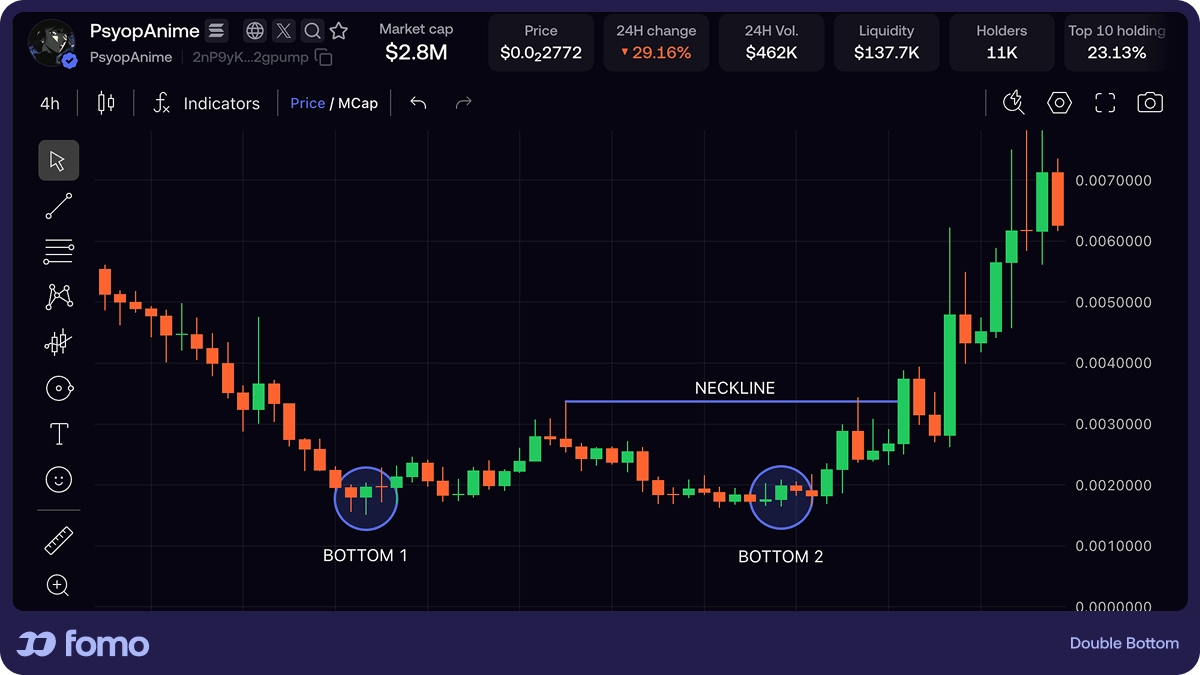
4. Double Bottom (Bullish Reversal)
The inverse of a double top, shaped like a "W." The price tests the same support level twice and bounces both times, indicating strong buying interest at that level. A breakout above the resistance between the two troughs confirms the reversal. Double bottoms often signal the end of a sell-off and the start of a recovery.
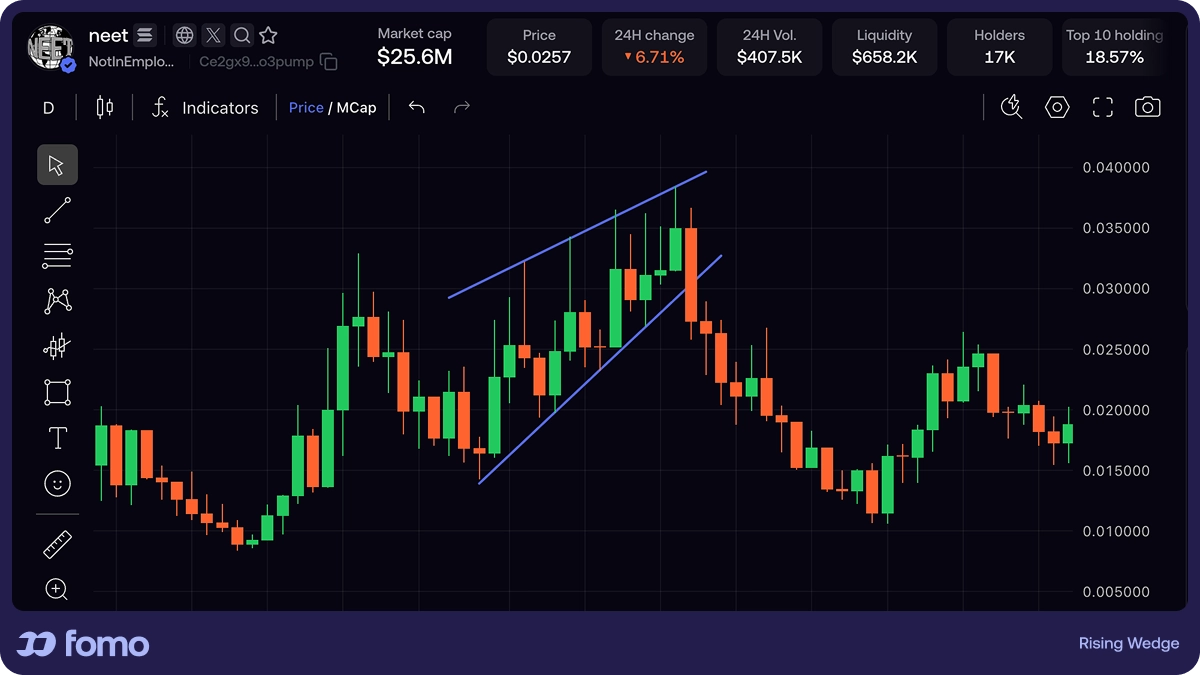
5. Rising Wedge (Bearish Reversal)
A rising wedge forms when both support and resistance lines slope upward but converge — the support line rises more steeply. This compression suggests that bullish momentum is fading even as prices inch higher. A breakdown below the lower trendline confirms the pattern. Rising wedges appear frequently in crypto during late-stage rallies, when enthusiasm is high but buying pressure is actually declining.
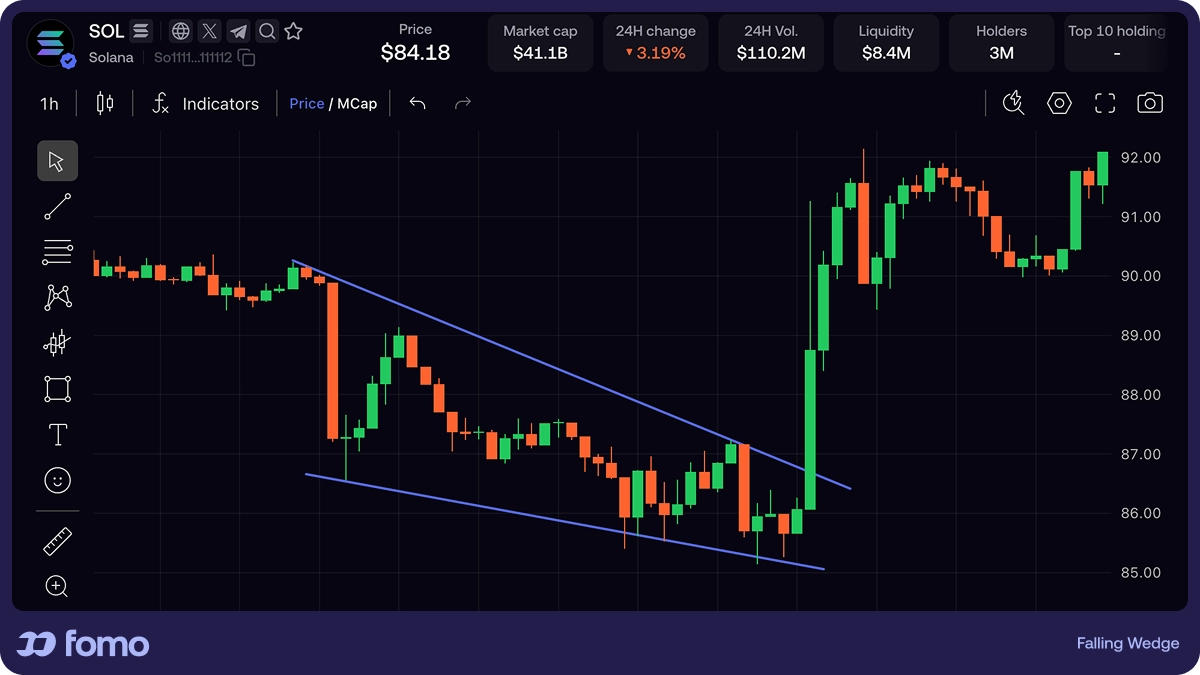
6. Falling Wedge (Bullish Reversal)
The counterpart to the rising wedge. Both trendlines slope downward and converge, with the resistance line falling more steeply. This signals that selling pressure is weakening. A breakout above the upper trendline confirms the pattern and often marks the beginning of a new uptrend. Falling wedges are especially useful for identifying bottoming formations in oversold altcoins.
Continuation Patterns
Continuation patterns form during a pause in the prevailing trend. They represent consolidation — a temporary balance between buyers and sellers before the dominant side reasserts control.
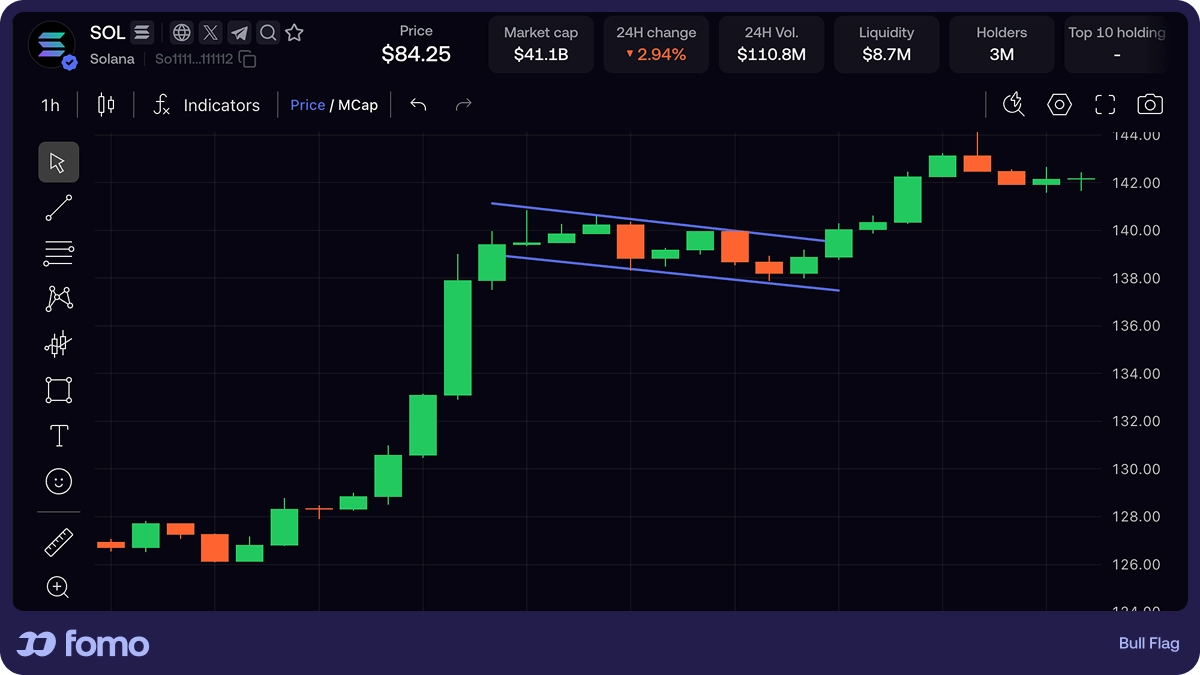
7. Bull Flag
One of the most popular continuation patterns in crypto. A bull flag starts with a sharp, near-vertical rally (the "flagpole"), followed by a brief downward-sloping consolidation channel (the "flag"). The pattern confirms when the price breaks above the upper boundary of the flag on rising volume. Bull flags are common in strong uptrends and can form on any timeframe, though they tend to be most reliable on 1-hour charts and above.
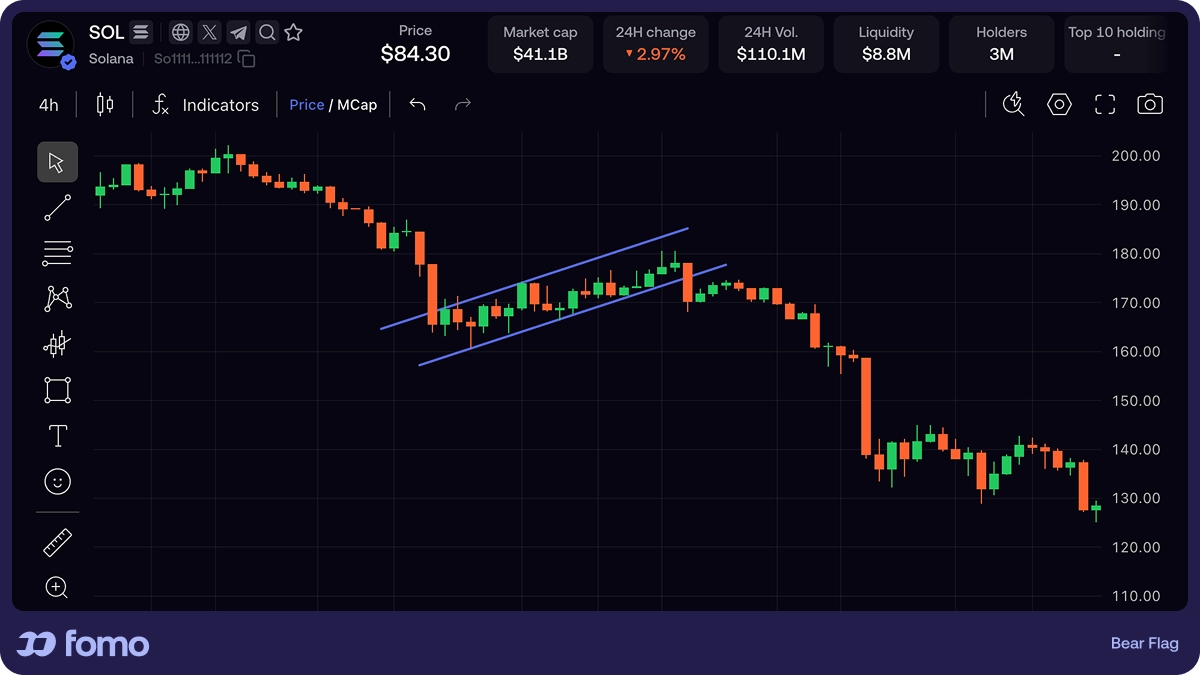
8. Bear Flag
The bearish mirror of a bull flag. A sharp decline forms the flagpole, followed by a brief upward-sloping consolidation. A breakdown below the lower flag boundary confirms the continuation of the downtrend. Bear flags frequently appear during sustained sell-offs and cascade events in crypto markets.
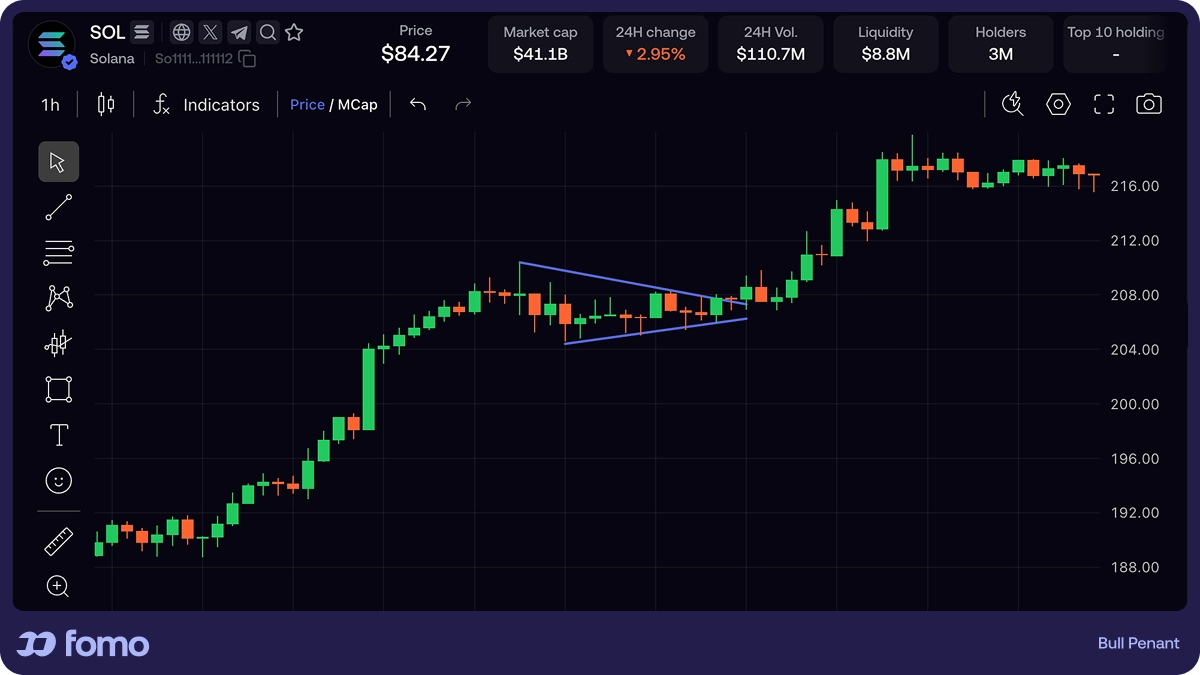
9. Bull Pennant
Similar to a bull flag, but the consolidation phase forms a small symmetrical triangle rather than a rectangle. The price makes lower highs and higher lows during the pause, compressing into a tighter range before breaking out to the upside. Pennants typically resolve faster than flags and are associated with strong momentum moves.
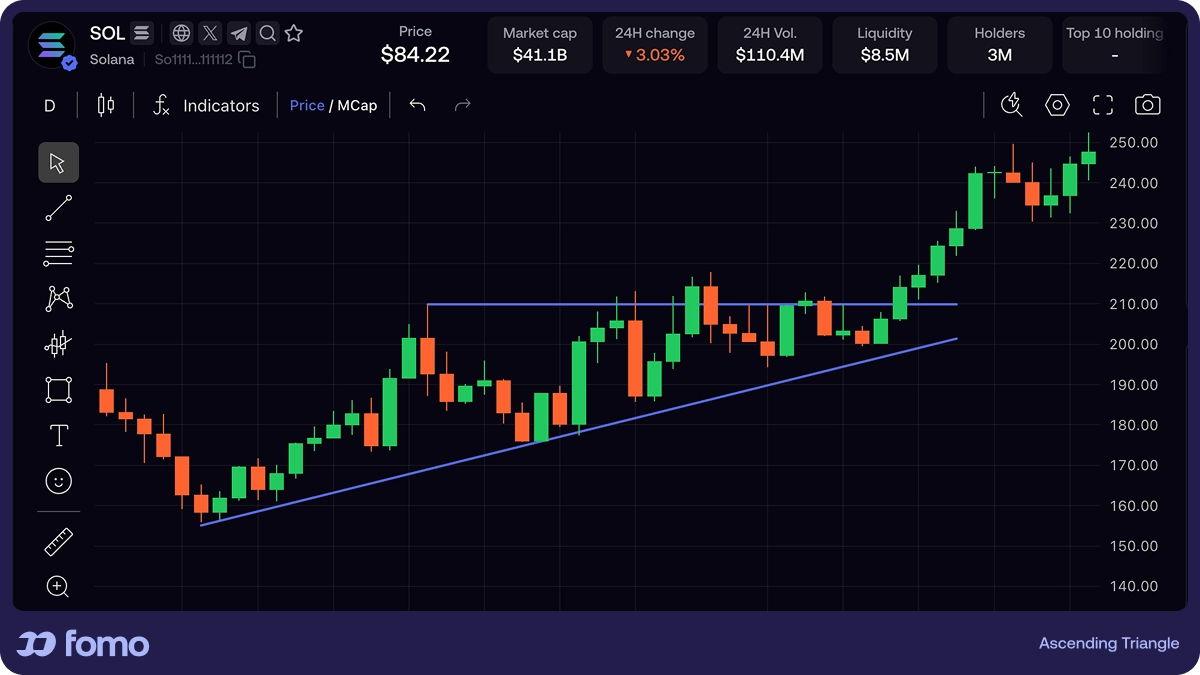
10. Ascending Triangle (Bullish Bias)
An ascending triangle features a flat horizontal resistance line at the top and a rising support line at the bottom. Each dip finds support at a higher level, showing increasing buyer pressure against a fixed resistance point. The expected move is a breakout above the flat resistance. This is one of the most reliable continuation patterns, and in crypto, it often precedes significant rallies when it forms during an uptrend.
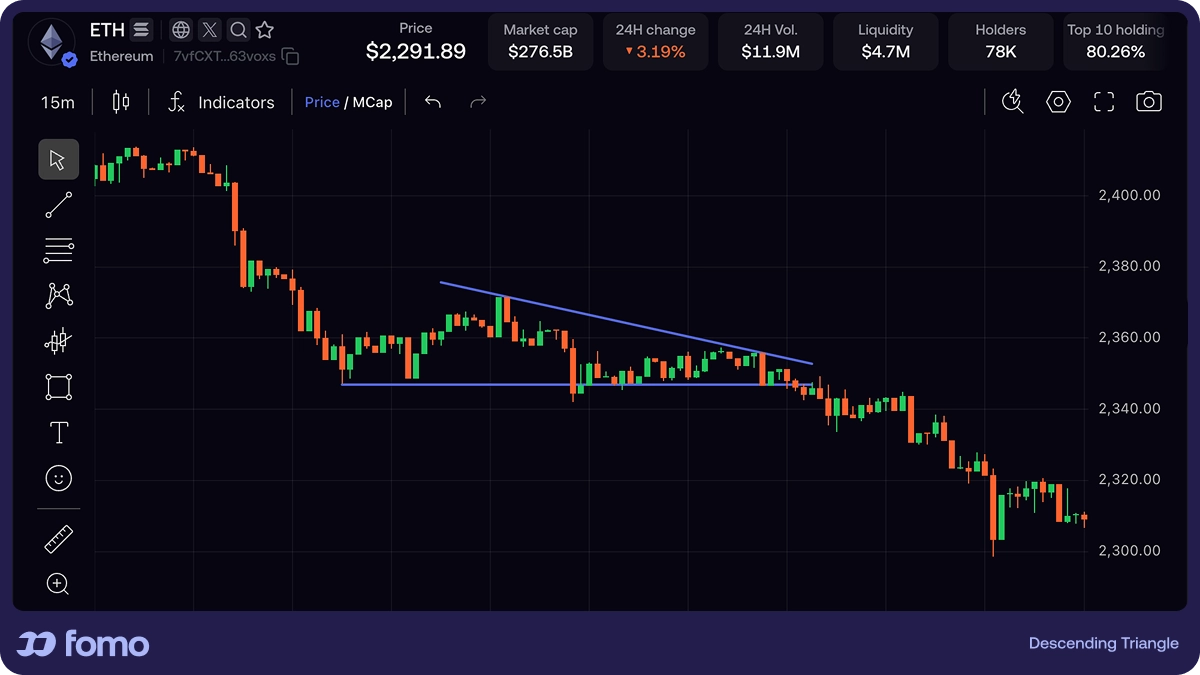
11. Descending Triangle (Bearish Bias)
The inverse of an ascending triangle. A flat support level at the bottom combined with a falling resistance line at the top. Sellers are steadily pushing the price down, and the flat support is under increasing pressure. A breakdown below support typically follows. In crypto, descending triangles often appear during bear markets or correction phases.
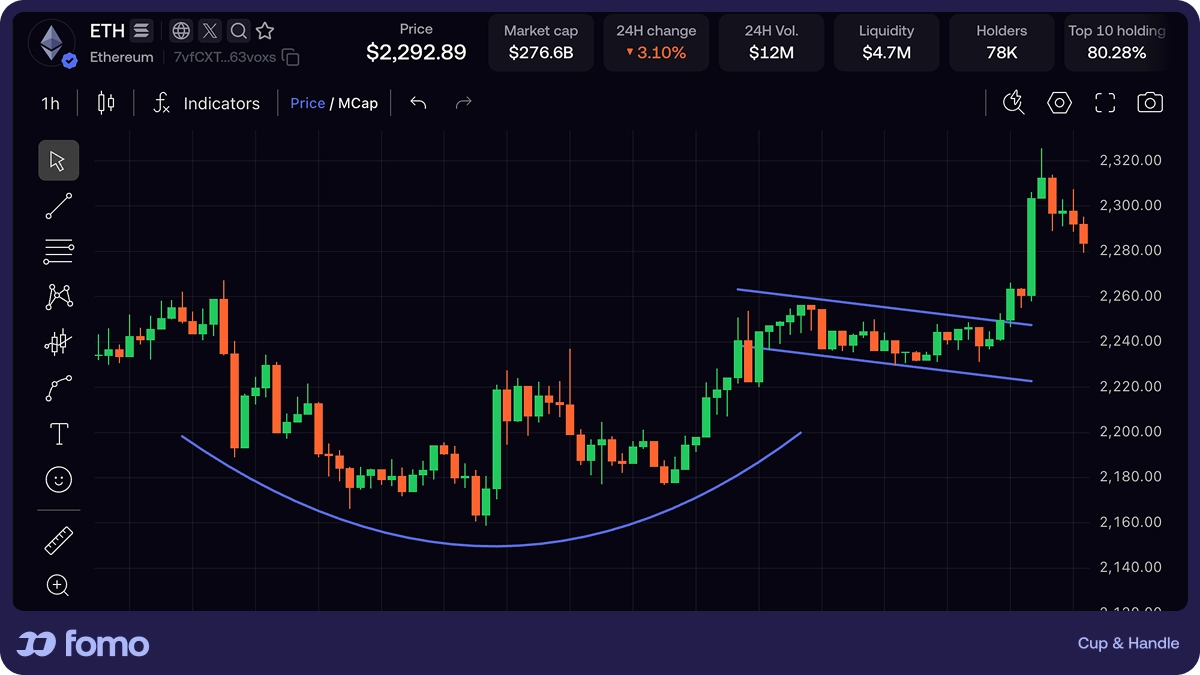
12. Cup and Handle (Bullish Continuation)
The cup and handle consists of a U-shaped recovery (the "cup") followed by a small downward consolidation (the "handle"), then a breakout above the cup's resistance level. The cup represents a period of accumulation where selling pressure gradually exhausts, and the handle is a final shake-out of weaker hands before the rally. This pattern tends to play out over longer timeframes — days to weeks in crypto — and is a strong signal when accompanied by rising volume on the breakout.
Bilateral Patterns
Bilateral patterns signal consolidation without a clear directional bias. The breakout direction determines the trade, so traders typically wait rather than anticipate.
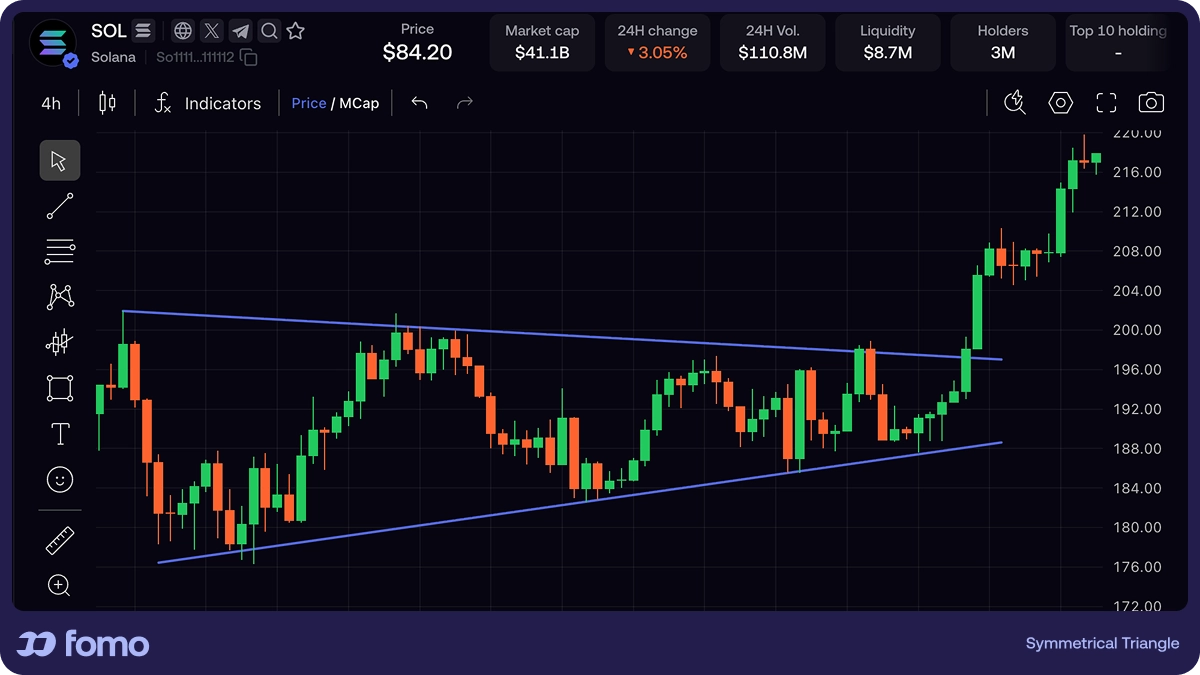
13. Symmetrical Triangle
A symmetrical triangle forms when both the support and resistance lines converge at roughly equal angles. The price makes lower highs and higher lows, compressing into a tighter range. The breakout can go in either direction, but it tends to favor the prevailing trend. Volume typically declines during the formation and spikes on the breakout. Symmetrical triangles are extremely common in crypto, especially during periods of indecision before major catalysts.
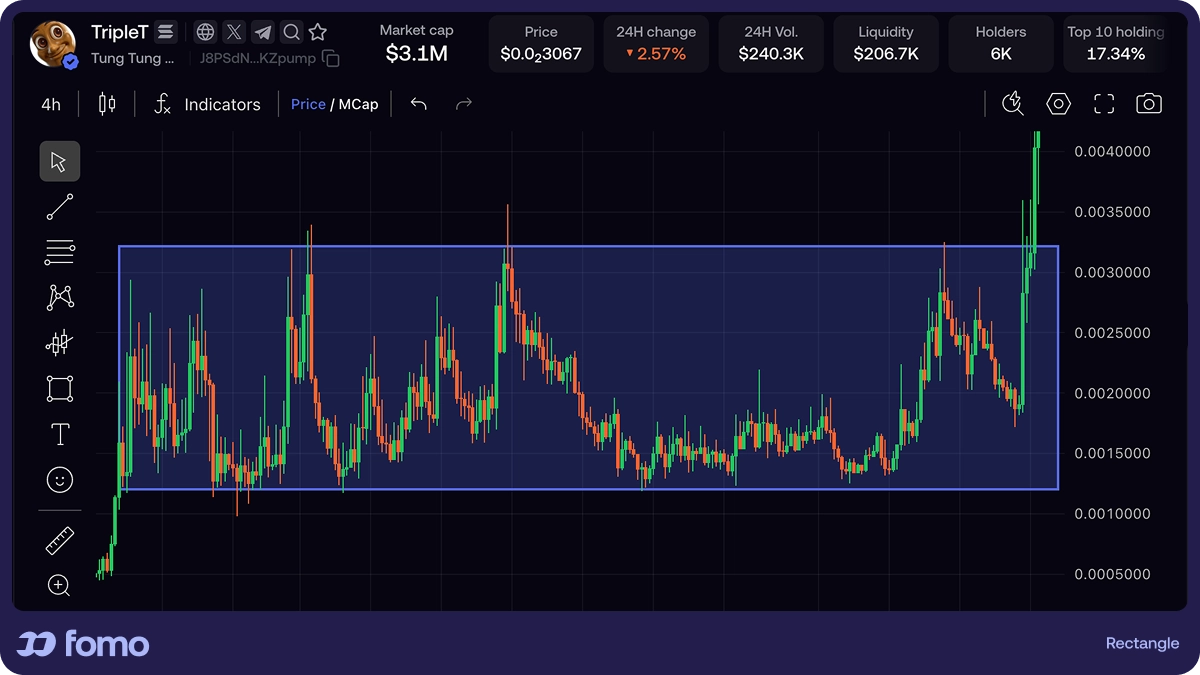
14. Rectangle (Range)
A rectangle forms when the price bounces between a horizontal support and resistance level, creating a sideways trading range. Neither buyers nor sellers can gain the upper hand. The pattern resolves when the price breaks decisively above resistance or below support. Rectangles are particularly useful for identifying accumulation (bullish) or distribution (bearish) zones.
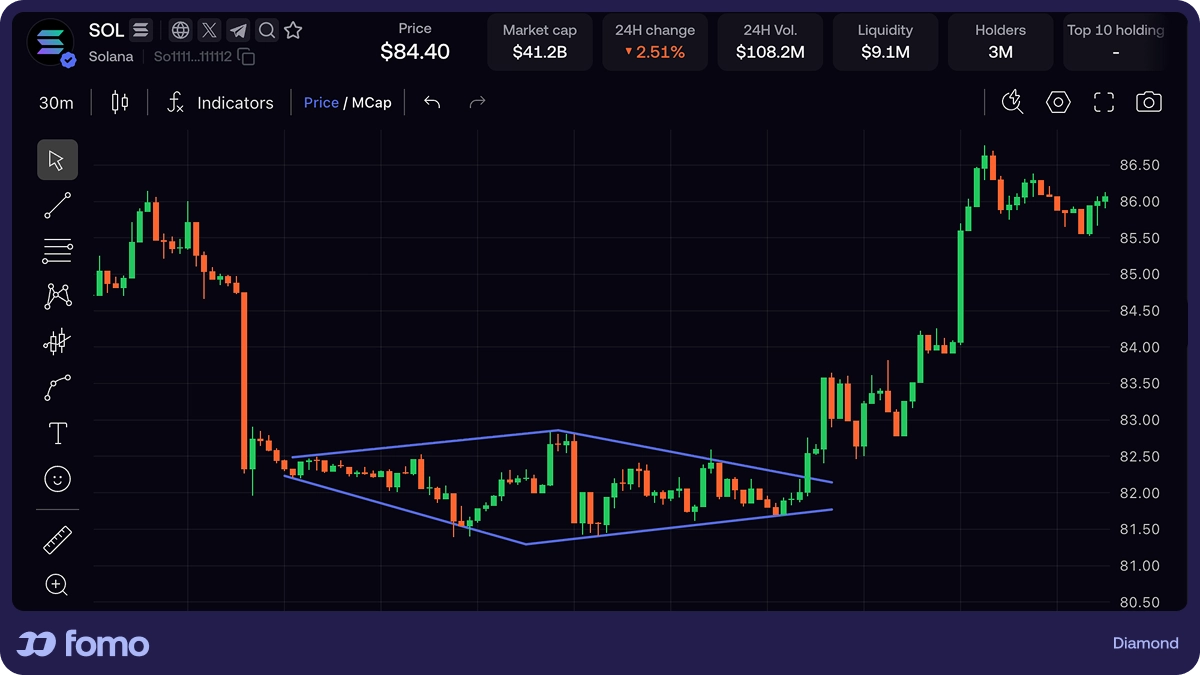
15. Diamond Pattern
The diamond pattern is rare but powerful. It starts with a broadening formation (expanding highs and lows) that transitions into a contracting formation (narrowing highs and lows), creating a diamond shape. It most commonly appears as a bearish reversal at market tops, though it can occasionally signal bullish reversals at bottoms. Because of its rarity, many traders miss it — which can make it a high-value signal when you do spot it.
How to Read and Trade Crypto Chart Patterns: A 5-Step Framework
Knowing what a pattern looks like is one thing. Trading it profitably is another. Here's a practical framework you can apply to any of the 15 patterns above.
Step 1: Identify the prevailing trend
Before spotting patterns, determine whether the market is in an uptrend, downtrend, or trading sideways. A bull flag in an uptrend has a very different implication than the same formation in a choppy, trendless market.
Step 2: Spot the pattern forming
Look for the recognizable shapes described above. Match what you see on the chart to a known formation from the 15 patterns in this guide. Don't force it — if the pattern isn't clear, it probably isn't one.
Step 3: Wait for confirmation
This is where most beginners make mistakes. Don't trade the pattern the moment you see it. Wait for the breakout or breakdown to actually occur, ideally with a significant increase in volume. A breakout on thin volume is much more likely to fail.
Step 4: Plan your entry and exit criteria
Decide where you'll enter based on the confirmed breakout, and define the conditions under which you'd exit — both if the trade works and if it doesn't. Having a plan before you enter removes emotion from the decision.
Step 5: Manage the trade
Monitor how price behaves after the breakout. Watch for signs that the move is stalling or that the pattern is failing. Staying disciplined about your exit criteria — rather than hoping or guessing — is what separates consistent traders from reactive ones.
Before You Trade a Pattern — Quick Checklist
- ✅ Is the prevailing trend clear?
- ✅ Has the pattern fully formed (don't anticipate)?
- ✅ Is volume confirming the breakout?
- ✅ Have you defined your exit criteria (both directions)?
- ✅ Does the risk-to-reward ratio make sense?
Why Chart Patterns Hit Different in Crypto
If you're coming from stock or forex trading, you'll notice that crypto chart patterns have some unique characteristics worth understanding.
Crypto markets never close. There's no opening bell or after-hours gap. This means patterns can form and complete around the clock, and breakouts can happen at any time — including 3 AM on a Sunday. This gives crypto patterns a faster lifecycle compared to traditional markets.
Volatility is structurally higher. The average daily price swing in Bitcoin regularly exceeds what major stocks move in a week. For altcoins and memecoins, the swings can be dramatically larger. This means you'll need to account for wider price ranges when trading crypto chart patterns, and measured-move expectations may be reached faster.
Social sentiment is a major accelerant. In traditional markets, chart patterns play out based largely on institutional flows and algorithmic trading. In crypto — especially for smaller tokens — social media hype, influencer calls, and visible trader behavior can rapidly accelerate a pattern's resolution or, conversely, blow it up entirely.
This is where combining technical analysis with social signals becomes valuable. Seeing that multiple profitable traders are buying a token while a bullish pattern forms on the chart is a stronger signal than either data point alone. Platforms like fomo overlay other traders' buy and sell actions directly on the price chart, and let you follow top traders so you get notified every time they make a move — adding a real-time social layer that traditional charting tools don't provide.
5 Common Mistakes When Trading Crypto Chart Patterns
1. Trading before confirmation
The most expensive mistake. Entering a trade because a pattern "looks like" it's forming — before it actually breaks out — means you're guessing, not trading. Always wait for the breakout and volume confirmation.
2. Ignoring volume
A breakout without volume is a breakout without conviction. Genuine breakouts from chart patterns are almost always accompanied by a notable increase in trading volume. Low-volume breakouts frequently reverse.
3. Using patterns on low-liquidity tokens without caution
Chart patterns are less reliable on tokens with thin order books. A whale can push the price through a support or resistance level, trigger a wave of reactive selling or buying, and reverse the move within minutes. If you're trading patterns on smaller tokens, be extra cautious with position sizes.
4. Over-relying on a single pattern
A double bottom on a 15-minute chart isn't the same as a double bottom on the daily. Context matters — trend direction, timeframe, volume, and broader market conditions all influence whether a pattern will play out. Patterns work best when they align with other signals.
5. Forgetting risk management
No pattern works 100% of the time. Even well-confirmed formations fail regularly. If you're not thinking carefully about position sizing and when you'll exit, one failed pattern can wipe out the gains from several successful ones.
Pro Tips
- 🔑 Start with just 3–4 patterns. Master head and shoulders, double tops/bottoms, and bull flags before expanding your repertoire.
- 🔑 Higher timeframes are more reliable. A pattern on the daily chart carries more weight than one on the 5-minute chart.
- 🔑 Combine patterns with social context. Watch what other traders are doing when a pattern forms. If profitable traders are piling in alongside a bullish breakout, that's added conviction. On fomo, you can follow top traders and see their moves in real time — a useful layer on top of chart analysis.
Best Timeframes and Tools for Crypto Chart Patterns
Recommended timeframes: For most traders, the 4-hour, daily, and weekly charts offer the best balance of signal reliability and trade frequency. Patterns on these timeframes have more data behind them and are less susceptible to noise. Scalpers may use 15-minute or 1-hour charts, but should expect a higher rate of false signals.
Charting tools: TradingView is the industry standard for crypto technical analysis, and fomo integrates TradingView charts directly into the app — so you can analyze patterns and execute trades in the same place, without switching between tools.
Adding a social layer: Pure technical analysis tells you what the chart is doing. Social trading tools tell you what other traders are doing about it. fomo displays TradingView-powered charts for every token, and overlays real trader buy/sell activity directly on those charts. You can also see buyer-versus-seller ratios, holder concentration, and what the most profitable traders are buying — all in one view. It's a way to add context that traditional charting tools don't offer.
FAQ: Crypto Chart Patterns
What are crypto chart patterns?
Crypto chart patterns are recurring visual formations on cryptocurrency price charts that reflect the tug-of-war between buyers and sellers. Traders use these patterns to identify potential breakouts, reversals, or trend continuations based on how similar formations have behaved historically.
Do chart patterns actually work in crypto?
Yes, chart patterns have measurable statistical tendencies in crypto markets, just as they do in stocks and forex. However, they work as probability tools, not certainties. False breakouts are more common in crypto due to higher volatility and lower liquidity in many tokens. Patterns work best when confirmed with volume and used alongside risk management.
What is the most reliable crypto chart pattern?
The head and shoulders pattern is widely considered one of the most reliable reversal signals when fully confirmed with volume. Bull flags and ascending triangles are also highly regarded for continuation signals. Reliability depends heavily on the timeframe, the token's liquidity, and whether volume confirms the breakout.
What is the best timeframe for crypto chart patterns?
The 4-hour and daily timeframes offer the best combination of reliability and actionability for most traders. Weekly charts provide the strongest signals but fewer opportunities. Shorter timeframes (5-minute, 15-minute) produce more patterns but with significantly higher noise and false-signal rates.
Are crypto chart patterns the same as stock chart patterns?
The patterns themselves are identical — a head and shoulders looks the same whether it forms on an Apple stock chart or a Bitcoin chart. The difference is in how they behave. Crypto patterns tend to form faster due to 24/7 trading, produce sharper moves due to higher volatility, and are more prone to false breakouts on low-liquidity assets.
How do you confirm a chart pattern breakout?
The most reliable confirmation is a combination of three things: the price closing beyond the pattern's key level (support or resistance), a notable increase in trading volume on the breakout candle, and ideally the same signal appearing on a higher timeframe. A breakout without volume is a common trap.
What is a bull flag in crypto?
A bull flag is a continuation pattern that forms during an uptrend. It consists of a sharp rally (the "flagpole") followed by a brief downward-sloping consolidation (the "flag"). When the price breaks above the upper boundary of the flag on increasing volume, it signals that the uptrend is likely to continue.
Why do chart patterns sometimes fail in crypto?
Patterns can fail due to sudden news events, whale manipulation, cascading liquidations, or simply because the pattern was ambiguous and traders misidentified it. Low-liquidity tokens are especially prone to false breakouts because less capital is needed to push the price through key levels. This is why disciplined risk management is essential.
Key Takeaways
- Crypto chart patterns are visual formations on price charts that reflect market psychology. They help traders anticipate breakouts, reversals, and continuations.
- You don't need to learn every pattern. The 15 covered in this guide — spanning reversal, continuation, and bilateral categories — account for the vast majority of actionable setups in crypto.
- Always wait for confirmation before entering a trade. A breakout without volume confirmation is one of the most common traps in pattern trading.
- Higher timeframes (4H, daily, weekly) produce more reliable patterns than lower timeframes.
- Chart patterns work as probability tools, not guarantees. Risk management — including thoughtful position sizing and clear exit criteria — is non-negotiable.
- Combining chart analysis with social signals (watching what other traders are doing) adds a context layer that can improve decision-making.
- Start small. Master 3–4 patterns deeply before expanding your toolkit. Depth beats breadth.
Why fomo
If you want to pair chart pattern analysis with real-time social context, fomo is built for that. The app integrates TradingView charts directly, with other traders' buy and sell actions overlaid on the price chart — so you can see when top traders are entering or exiting alongside the patterns you're spotting. You can follow profitable traders, get notified on every move they make, and track leaderboard rankings across 24-hour, 7-day, and 30-day windows.
Disclaimer: This article is for educational and informational purposes only and does not constitute financial or investment advice. Cryptocurrency trading involves significant risk, including the potential loss of your entire investment. Chart patterns are analytical tools that reflect historical tendencies — they do not guarantee future results. Always conduct your own research and consider your risk tolerance before making trading decisions.